
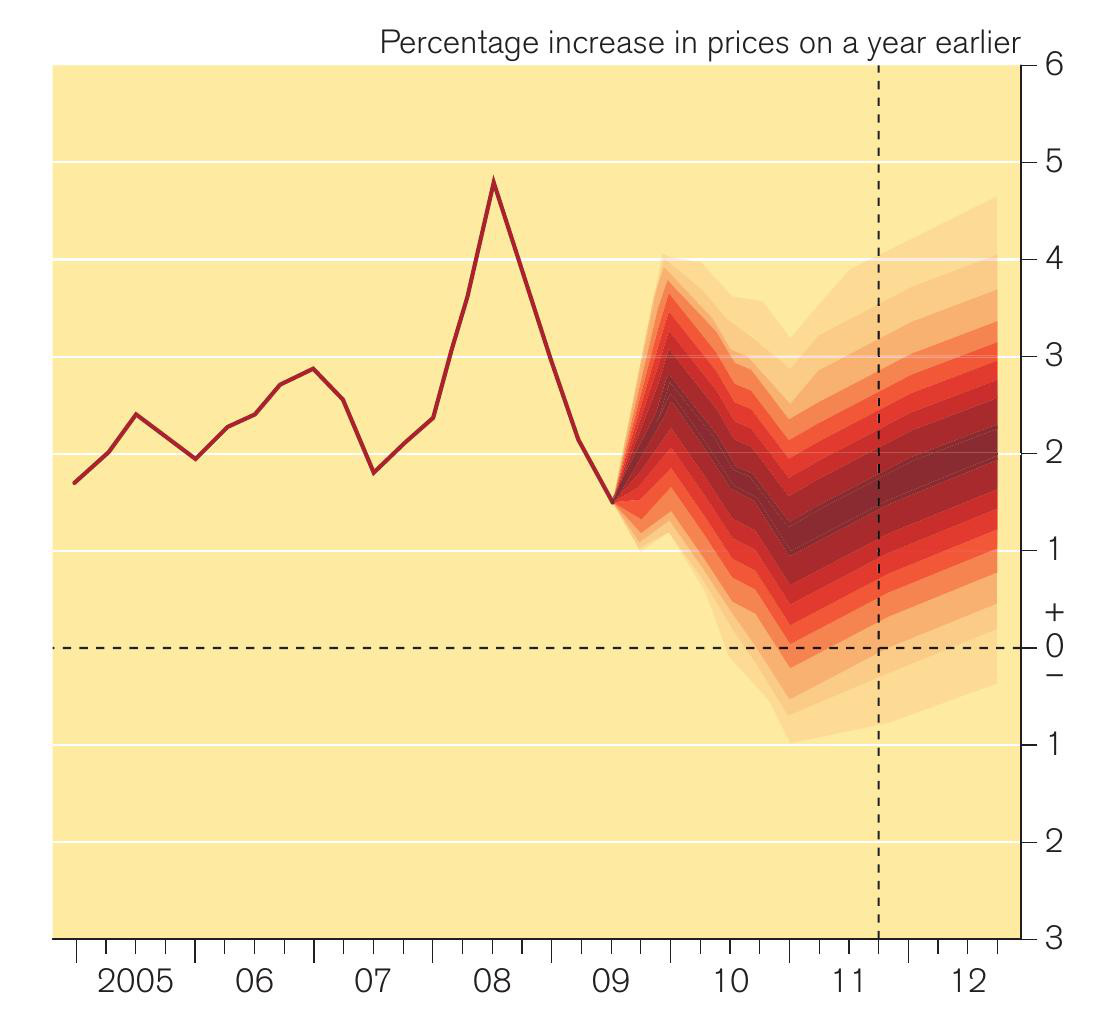
The fan charts in Figures 1 and 2 show past data and future forecasts for inflation and GDP compiled by the Bank of England. A range of possible outcomes are given for the projections, highlighting the uncertainty that there always is when looking forward. The darker the colour the more likely the outcome; the lighter the shading the less likely the outcome. Even when looking backwards at past data there can be some uncertainty. For example, the Bank of England may not be entirely sure what the GDP (national income) was because some of the income earned may not have been declared and therefore has to be estimated.
(1) Summarise the changes in Figures 1 and 2 between 2005 and 2009, and between 2009 and 2012.
Your organisation does not have access to this article.
Sign up today to give your students the edge they need to achieve their best grades with subject expertise
Subscribe