ECONOMICS IN THE REAL WORLD
Inflation and the cost of living
The cost of living is a hotly debated topic. The current ‘crisis’ stems from a rapid increase in prices and a steady reduction in living standards. How can economics help us explain the origin and likely evolution of this crisis?
One of the key indicators that informs us about the performance of the economy is the rate of inflation. This is defined as the percentage rate of increase in the general price level in an economy. During 2022, the rate of inflation accelerated rapidly, giving concerns that the UK was facing a cost of living crisis.
Alternative measures of inflation
In the UK, the Office for National Statistics publishes three measures of inflation, as explained by Steven Proud in the February 2022 issue of ECONOMIC REVIEW. Most important are the consumer price index (CPI) and the consumer price index housing (CPIH). Both indexes are similar in terms of the method of calculation, the population coverage and the basket of goods and services (about 700 products that people regularly buy are included in the basket) on which they are based.
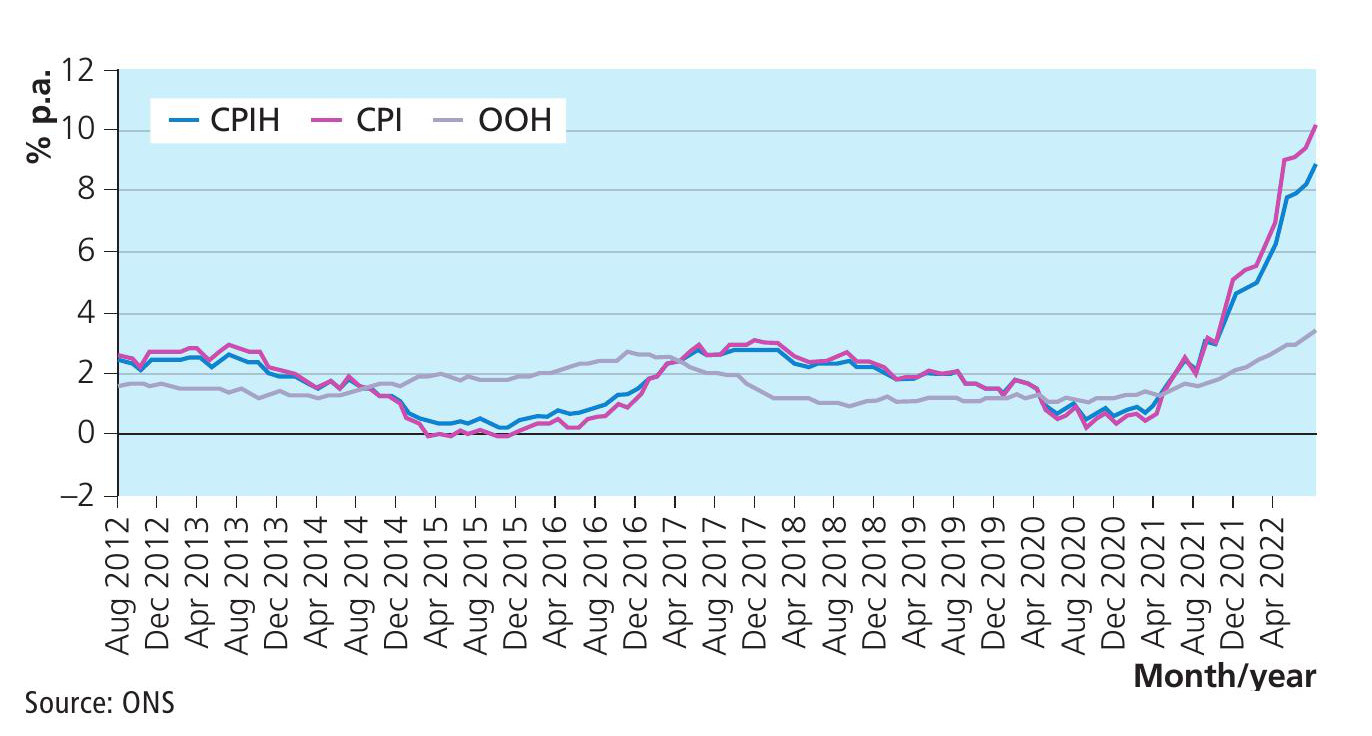
However, the CPIH also includes ‘owner occupiers’ housing’ (OOH) costs, with the aim of capturing the costs associated with owning, maintaining and living in one’s own home. These costs are different from the cost of purchasing a house and do not include mortgage interest costs. More generally, it is important to remember that the average price level can be measured in different ways by either using different methodologies or by including different products in the basket of goods and services. The discrepancy between the CPI and CPIH inflation is shown in Figure 1.
Recent fluctuations
Over the past 10 years the CPI and CPIH have closely tracked each other. More generally and importantly, the inflation rates have broadly fluctuated between the 0% to 2% range. The clear and sharp increase in prices is noticeable since the beginning of 2021 with the gradual reopening of the economy following the Covid-19 lockdowns and restrictions.
In the 12 months to October 2022, the CPI rose by 11.1% and CPIH by 9.6%. Interestingly, the CPIH annual rate was below 1.2% from April 2020, at the start of the first lockdown, to March 2021. Both rates have since risen markedly. Figure 1 also shows the change in housing costs and reveals an acceleration that is helping to fuel the increase in CPI.
Explaining accelerated inf lation
The next most natural question that these statistics raise is about the reasons for the acceleration in inflation. Figure 2 provides some interesting and important indications about the main drivers of the price increases.
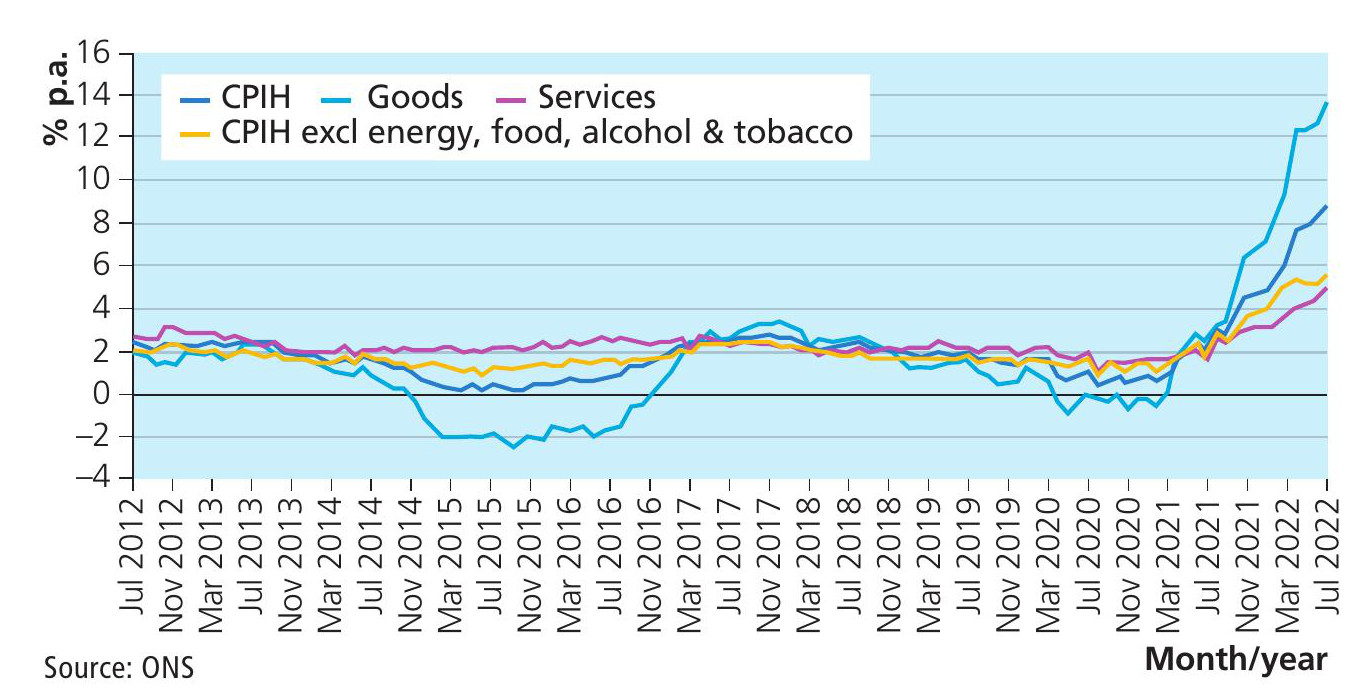
By computing the price index for only goods and a separate price index for only services, we can see that the largest increase in price comes from goods rather than services. The CPIH all-goods index rose by 13.6% in the 12 months to July 2022, while the CPIH all-services index rose by a much smaller 4.9% over the same period. Even more interestingly, the CPIH, excluding energy, food, alcohol and tobacco, rose by 5.5% over the past year. This suggests that some of the major contributors to the rise in average prices are the increases in the prices of food, energy and beverages, as confirmed in Figure 3.
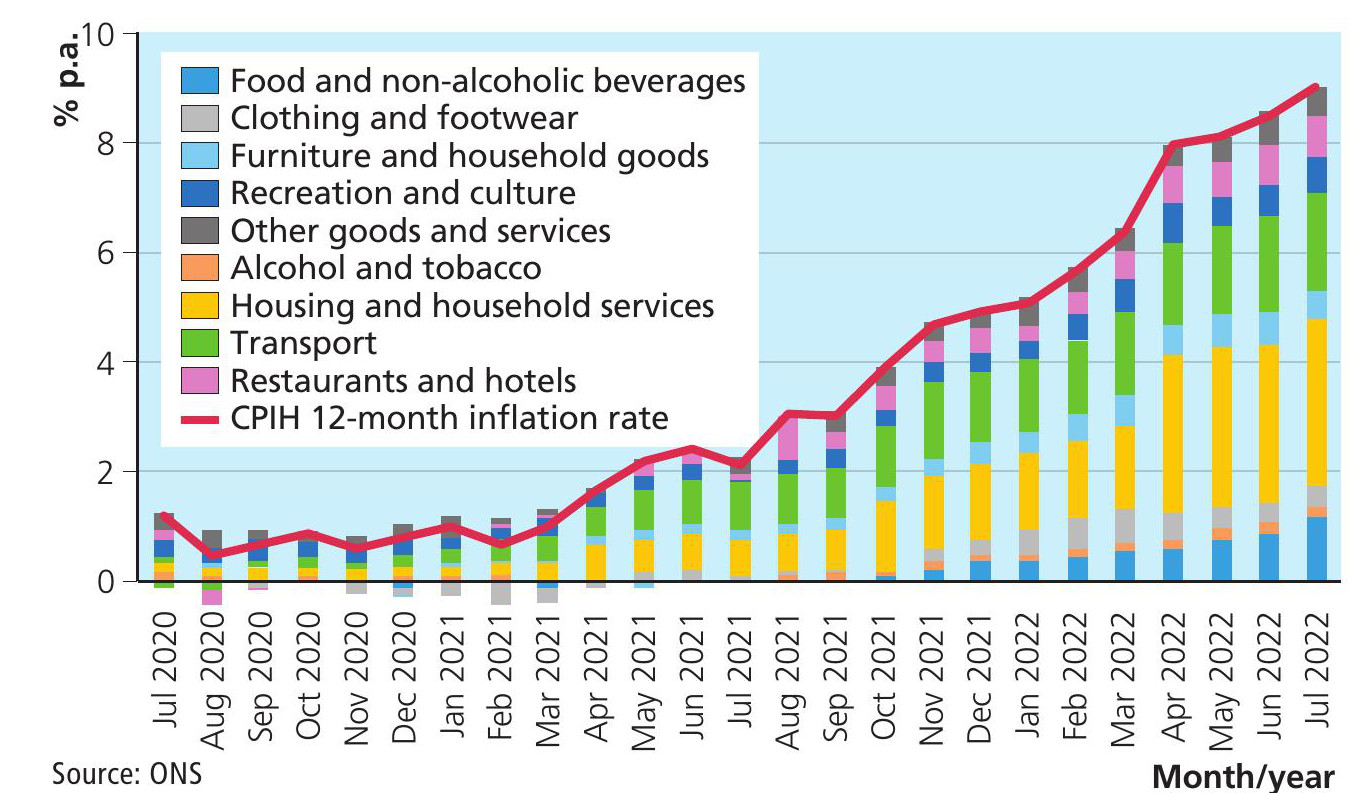
The largest upward contributions to the annual CPIH inflation rate in July 2022 came from housing and household services where prices rose at an annual rate of 2.91%,(principally from electricity, gas and other fuels, and owner-occupiers’ housing costs), transport (1.66%, principally from motor fuels) and food and non-alcoholic beverages (1.15%). Contributions from these three divisions accounted for 5.71%, which is nearly two-thirds of the annual CPIH inflation rate.
The relatively high contribution to the rate since April came mainly from electricity, gas and other fuels. This reflects price rises for gas and electricity following the increase in the Office of Gas and Electricity Markets (Ofgem) cap on energy prices on 1 April 2022, and follows an earlier rise in the price cap on 1 October 2021. Electricity prices rose by 54.0% and gas prices by 95.7% in the 12 months to July 2022.
Food and energy price increases
Average prices are increasing at the fastest rate for more than 30 years, driven by sharp increases in the price of energy as well as food. The next question we should ask ourselves is about the drivers for the increase in prices of gas and food. These drivers arise on both the demand- and supply-side.
The global demand for gas has increased sharply as economies gradually relaxed the restrictions introduced to combat the pandemic. The supply of gas has been disrupted by the conflict in Ukraine as well as by logistical issues. This combination of increasing demand and decreasing supply inevitably results in an increase in the price (as you can see by sketching a quick demand and supply diagram).
The cost of living crisis
A high inflation rate impacts on households’ cost of living in two ways. It reduces the ‘real’ earnings of households so that with the same income level fewer products and services can be purchased. Second, the rapid increase in the prices of some items such as energy and food, which are necessities for most households, is likely to reduce the share of income that is allocated to the purchases of other goods and services such as clothing, health and education.
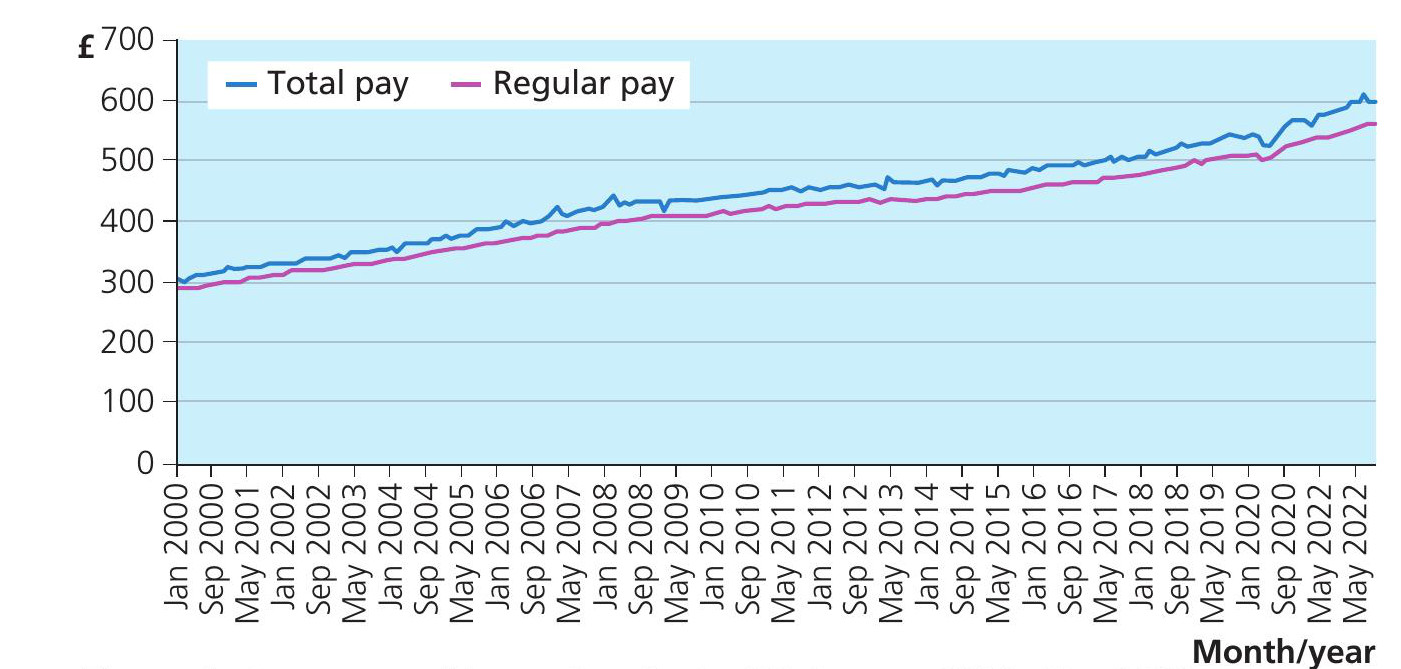
Figure 4 shows that average weekly earnings have steadily increased, with the exception of the early months of the pandemic. Average weekly earnings were estimated at £601 for total pay (including bonuses), and £565 for regular pay (excluding bonuses), in May 2022. However, this graph shows households’ nominal earnings — that is, earnings before taking inflation into account. The important distinction between real and nominal values was explained in ‘Quantitative skills’ in the November 2022 issue of ECONOMIC REVIEW.
Looking at real earnings
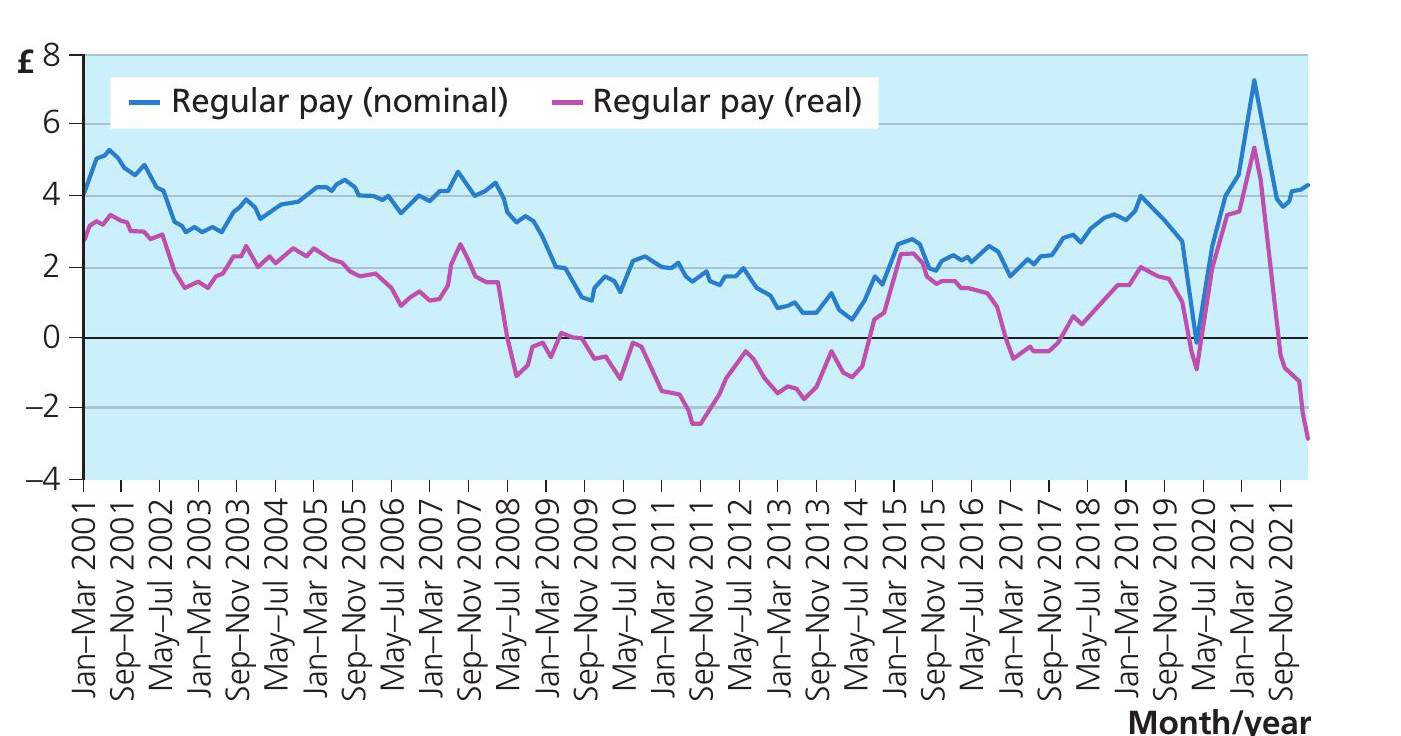
Figure 5 shows the nominal and real change in regular pay over the past 20 years and the evidence clearly shows that the real growth in earnings has always been lower than the nominal one. Up to 2008, real weekly earnings experienced a steady average increase at around 2%, but the 2008–14 period shows negative growth in real earnings for about 6 years, which means that, on average, households saw a steady reduction in their living standards.
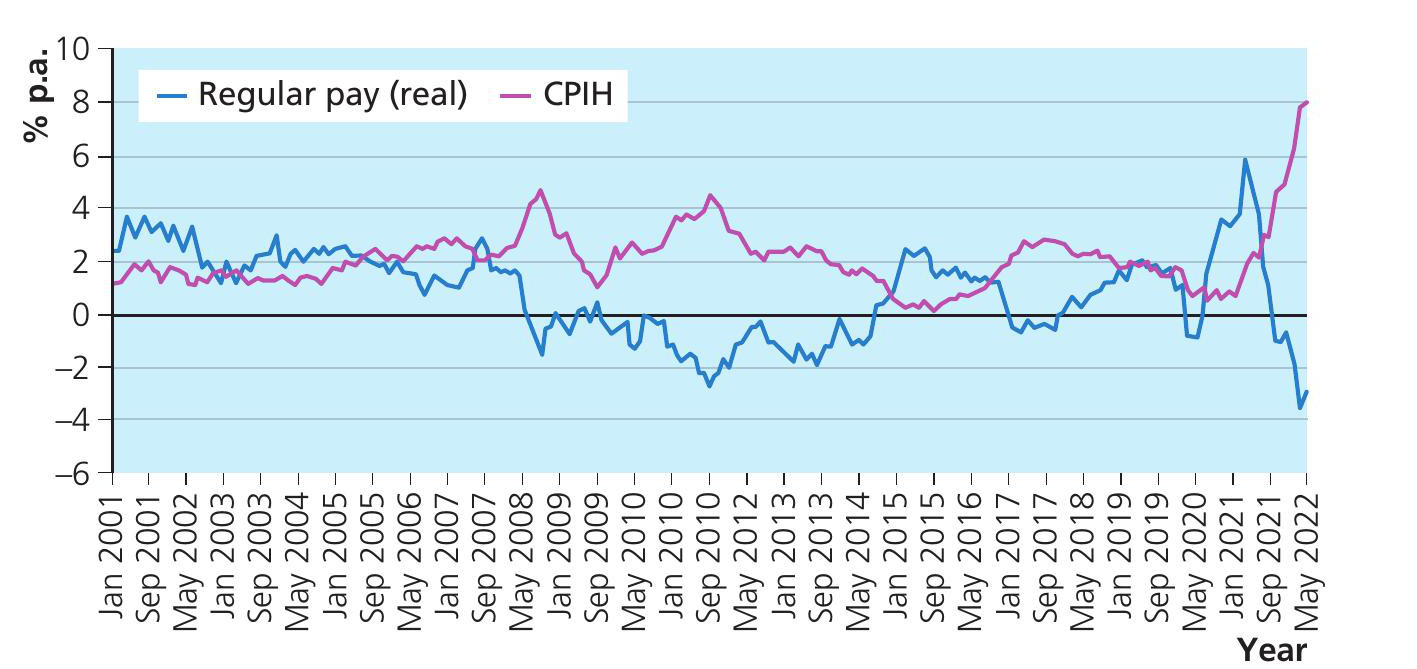
Real average earnings started rising again from the second half of 2014 but with the arrival of the pandemic, after a sharp fall and rebound, in more recent months real earnings have been falling. As shown in Figure 5 the increase in the cost of living is not something new, in particular when looking back at the post-financial crisis period. What is quite new is the sharp fall experienced over the last year. The divide between nominal and real earnings is mainly driven by the sharp increases in prices, as illustrated in Figure 6.
The squeeze in living standards has been felt not only in the UK but also around the world. Real wages have also been falling across the EU, with an average fall estimated at about 6.5% among the countries in the euro area. The data confirm that across countries inflation is eroding the purchasing power of households’ earnings.
Why are nominal earnings not increasing?
The increase in the price of energy also means that a larger share of income will be devoted to pay for the cost of energy and less to the purchase of other products. Widespread reliance on gas as an energy source will mean few households are immune from rising bills. However, homes with poor fuel efficiency will be hit hardest by energy price rises.
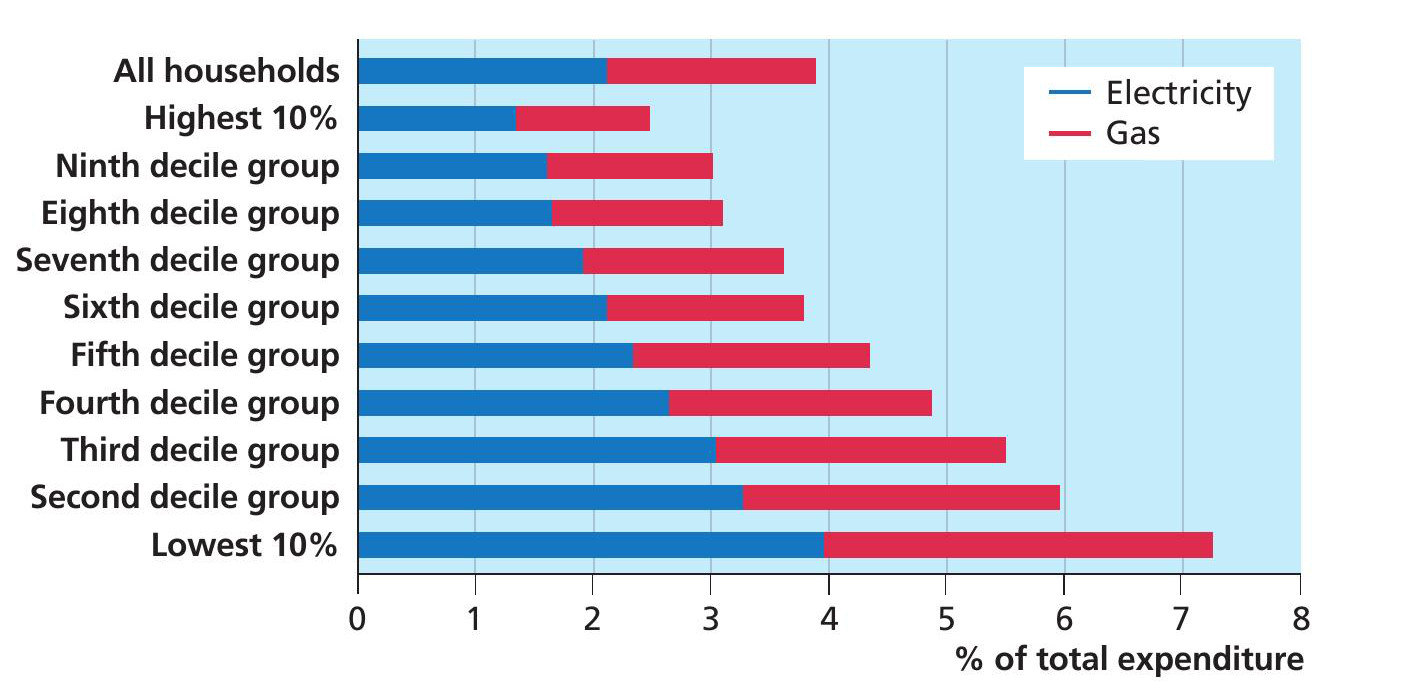
While rising energy prices will affect most households across the country, they are more likely to disproportionately affect those on the lowest incomes. In the financial year ending in 2020, the poorest 10% of households spent more than half (54%) of their average weekly expenditure (£298.90) on essentials such as housing (including electricity and gas), food and transport. Those in the richest 10%, in comparison, spend 42% of their average weekly spend of £1,073.20 on the same essentials.
As shown in Figure 7, spending on gas and electricity is also higher as a proportion of disposable income for those in the poorest 10% of households (7%) compared to those in the richest 10% of households (2%). As a result, an increase in energy prices disproportionately impacts low-income households.
To summarise, the cost of living crisis is a combination of rising energy prices, wages that do not increase in line with inflation and, hence, falling real wages. The government (and the Bank of England) faces a difficult dilemma with these pressures on aggregate supply and aggregate demand. To bring price changes under control would require a large increase in interest rate. However, this would then feed into higher mortgage rates, which then add to the increase in the cost of living. Notice that these changes do not influence either CPI or CPIH, suggesting that for some households the cost of living is increasing by even more than suggested by the data.


