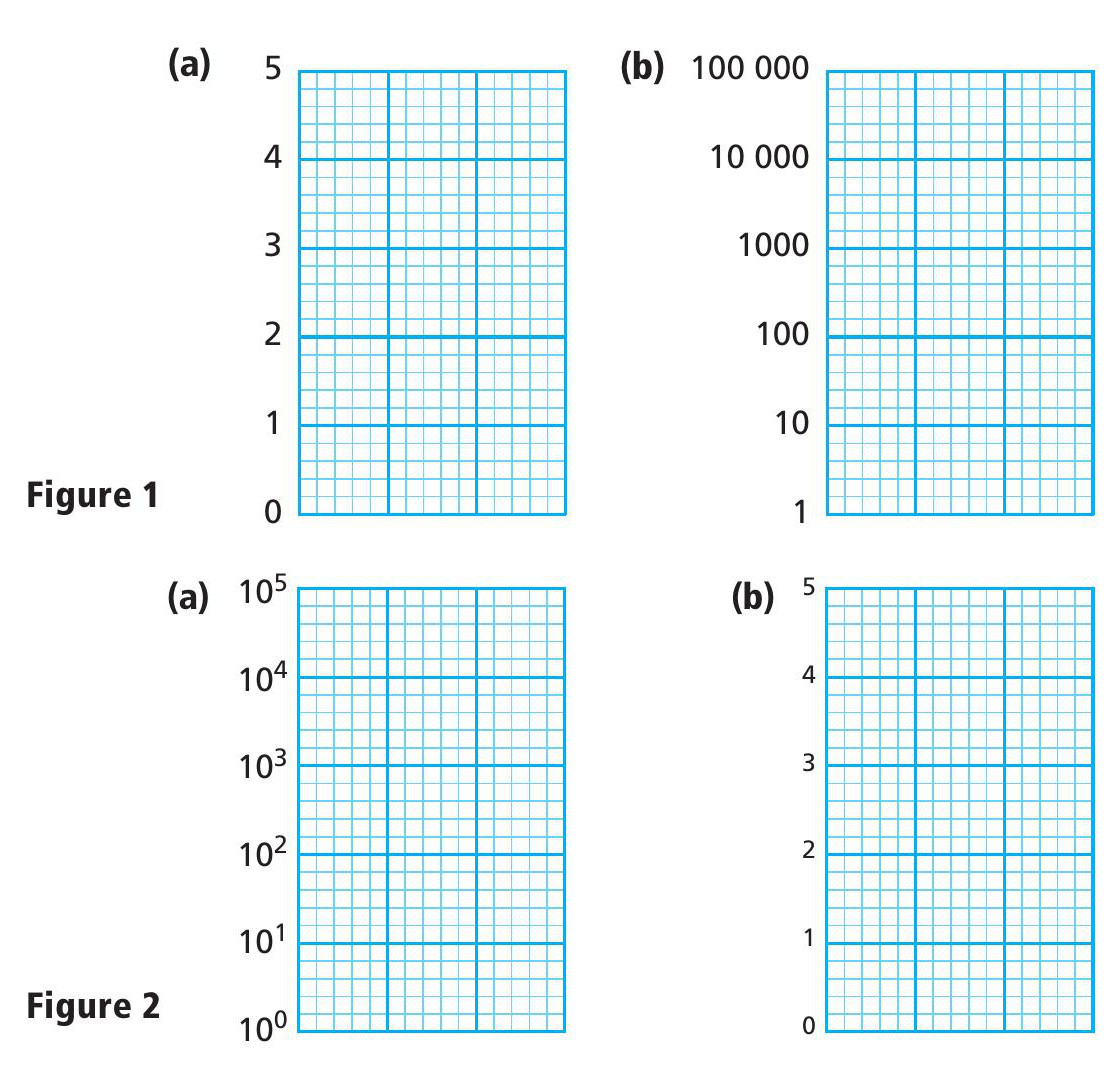
Isuppose if I’m to explain anything at all about logarithmic graphs, I ought to begin with a little bit about logarithms themselves. Look at Figure 1.
The left-hand graph (Figure 1a) has a linear scale. The numbers go up by the same amount each time. This is the type of graph that you have been using for years and have become familiar with. The right-hand graph (Figure 1b) is a bit different — instead of going up by the same amount each time, the numbers go up by the same ratio each time. In this particular example, each successive number on the scale is ten times the previous one, although there is no rule about this and it would be perfectly possible for the numbers to double each time, or indeed to increase in any ratio you wanted them to.
Your organisation does not have access to this article.
Sign up today to give your students the edge they need to achieve their best grades with subject expertise
Subscribe