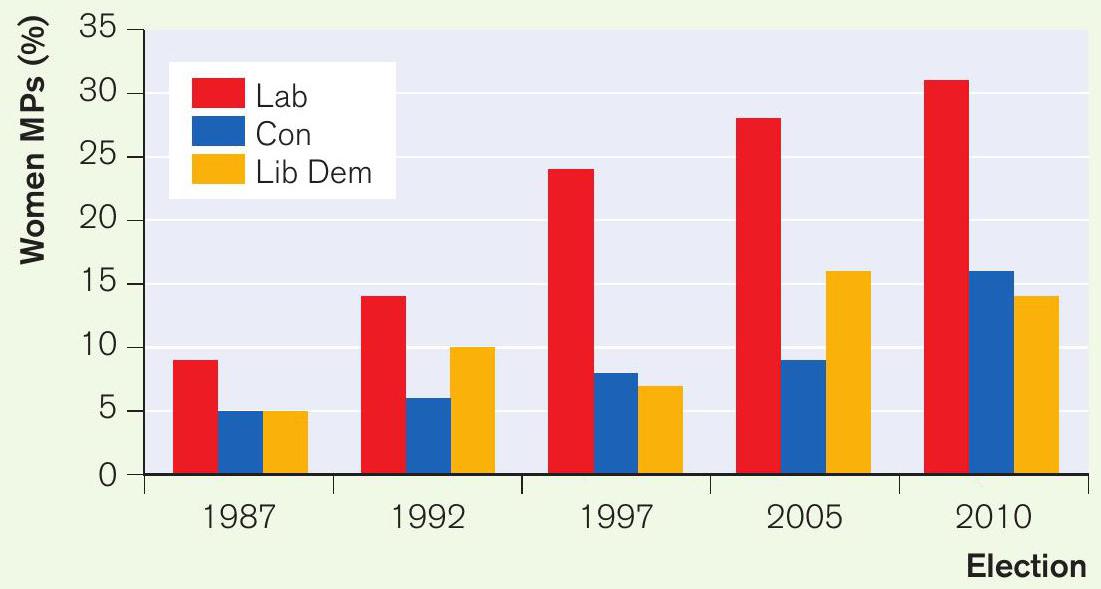
How important is it that MPs reflect the class, social and cultural and ethnic make-up of the people they govern? With a record new intake of MPs in the 2010 election following the expenses scandal, and a new determination among party leaders to make politics more relevant and more representative — perhaps especially to younger people — it is interesting to look at any marked changes in the people who make up the UK political system.
First, the average age of MPs has varied hardly at all since 1992 despite 35% of the new parliament in 2010 being newlyelected MPs. The average age was exactly 50 years in 1992 and in 2010 it was 49.8 years. Not much to shout about there.
Your organisation does not have access to this article.
Sign up today to give your students the edge they need to achieve their best grades with subject expertise
Subscribe