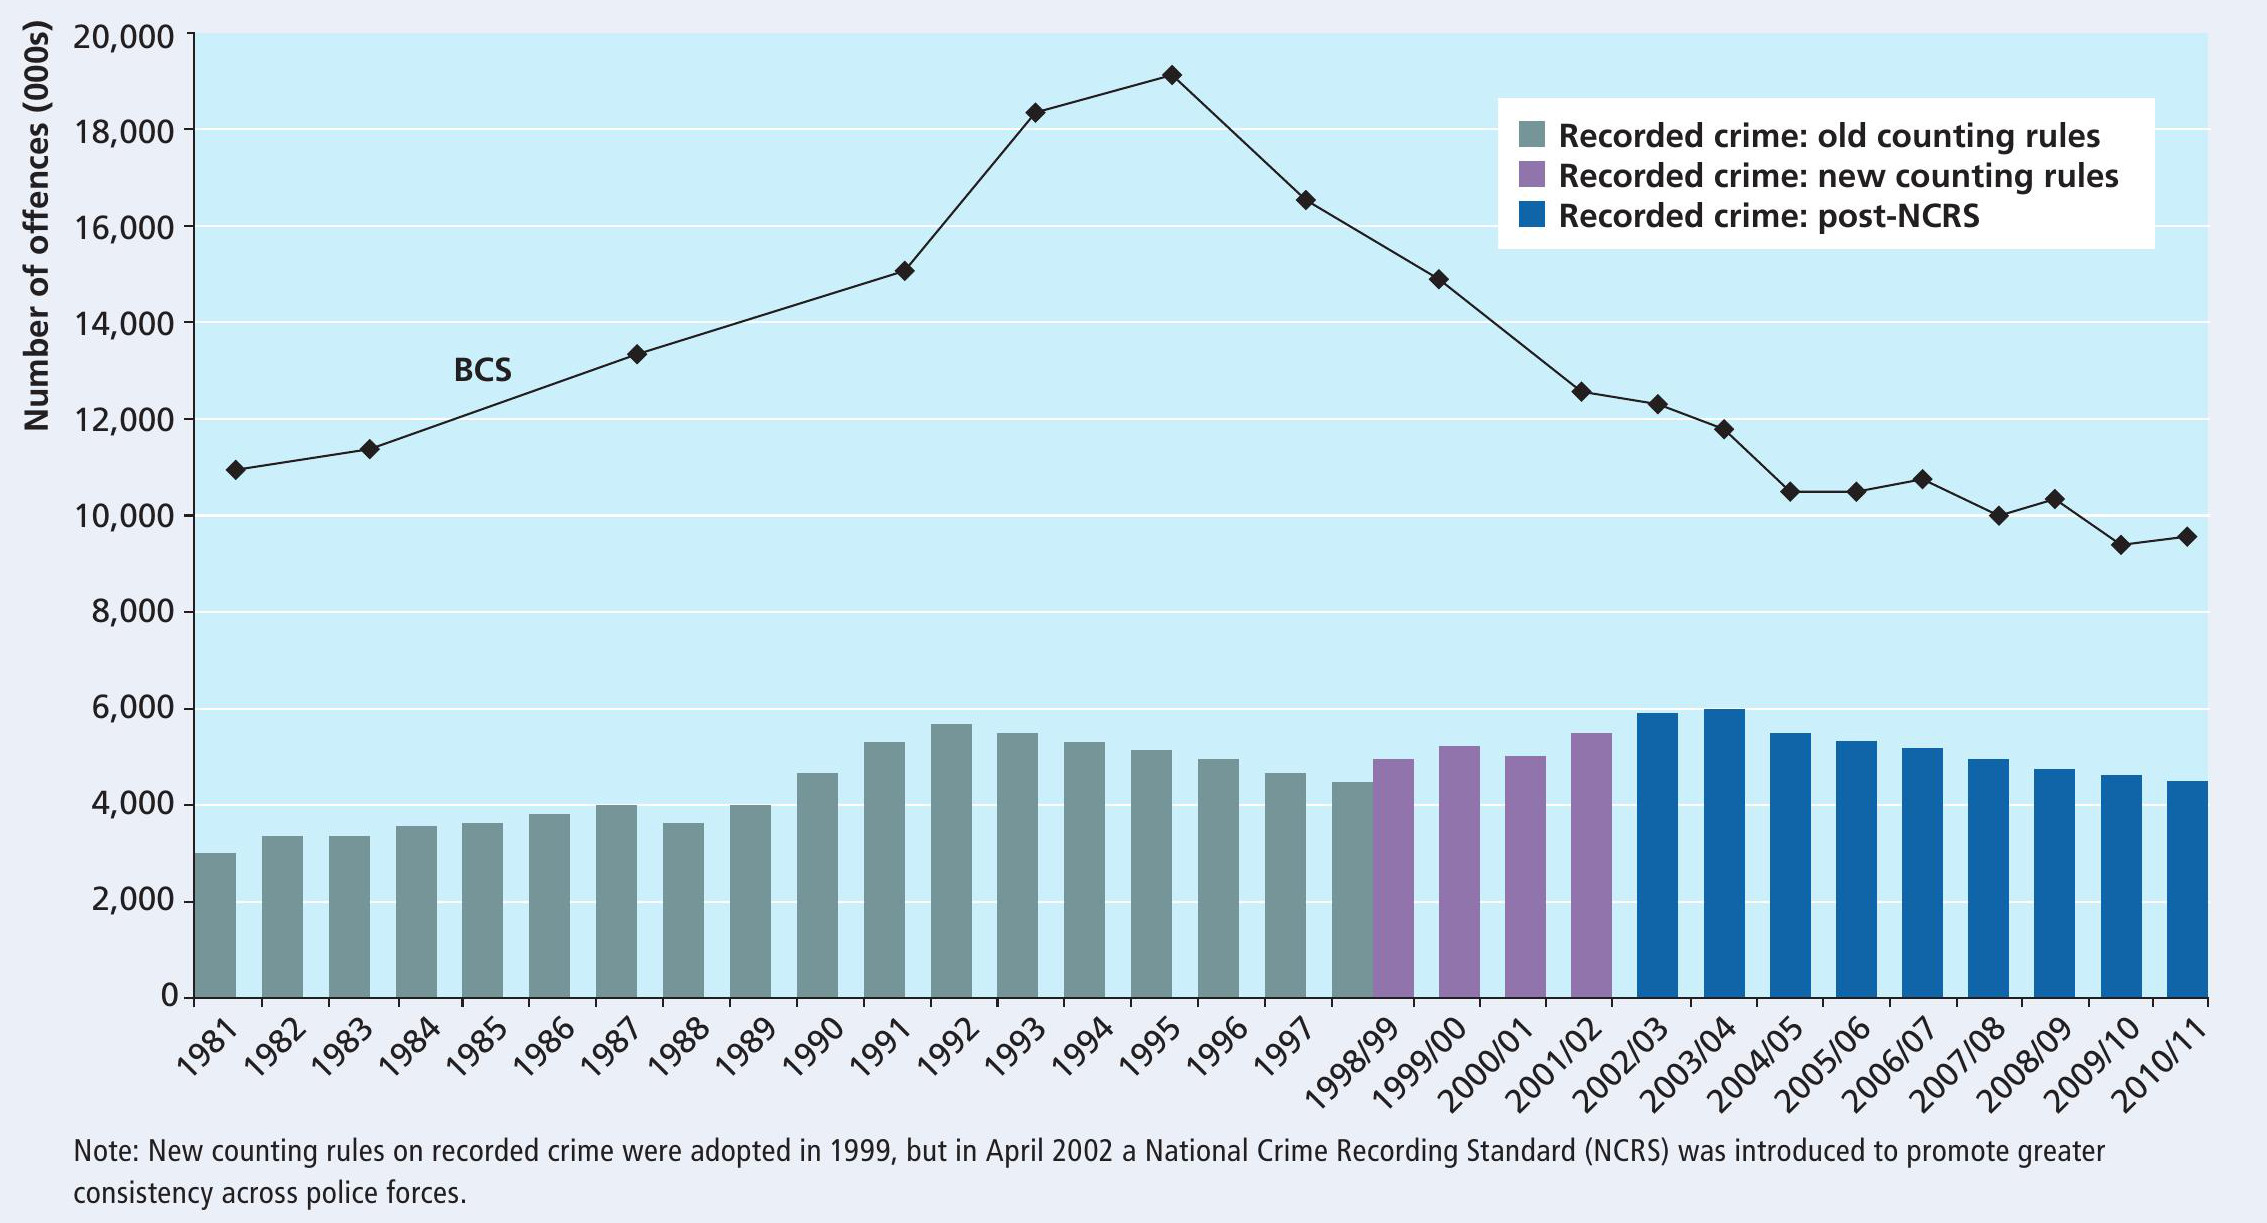
Clued-up sociology students will understand the different ways in which annual figures on crime are collected and presented. British Crime Survey (BCS) data and police statistics on crime show very different accounts of the levels and types of crime — the first as experienced by victims, and the second as recorded by the police (Figure 1). These data often suggest different trends in crime: BCS data might show a fall in crime, for example, while police data might point in the opposite direction. You could ask yourself why.
Since February 2011 the police have also been producing crime maps of local areas, showing the number of offences known to the police in specific locations (Figure 2). You can access crime data for your own area at: www.police.uk One year after it launched, the site had had 453 million hits!
Your organisation does not have access to this article.
Sign up today to give your students the edge they need to achieve their best grades with subject expertise
Subscribe