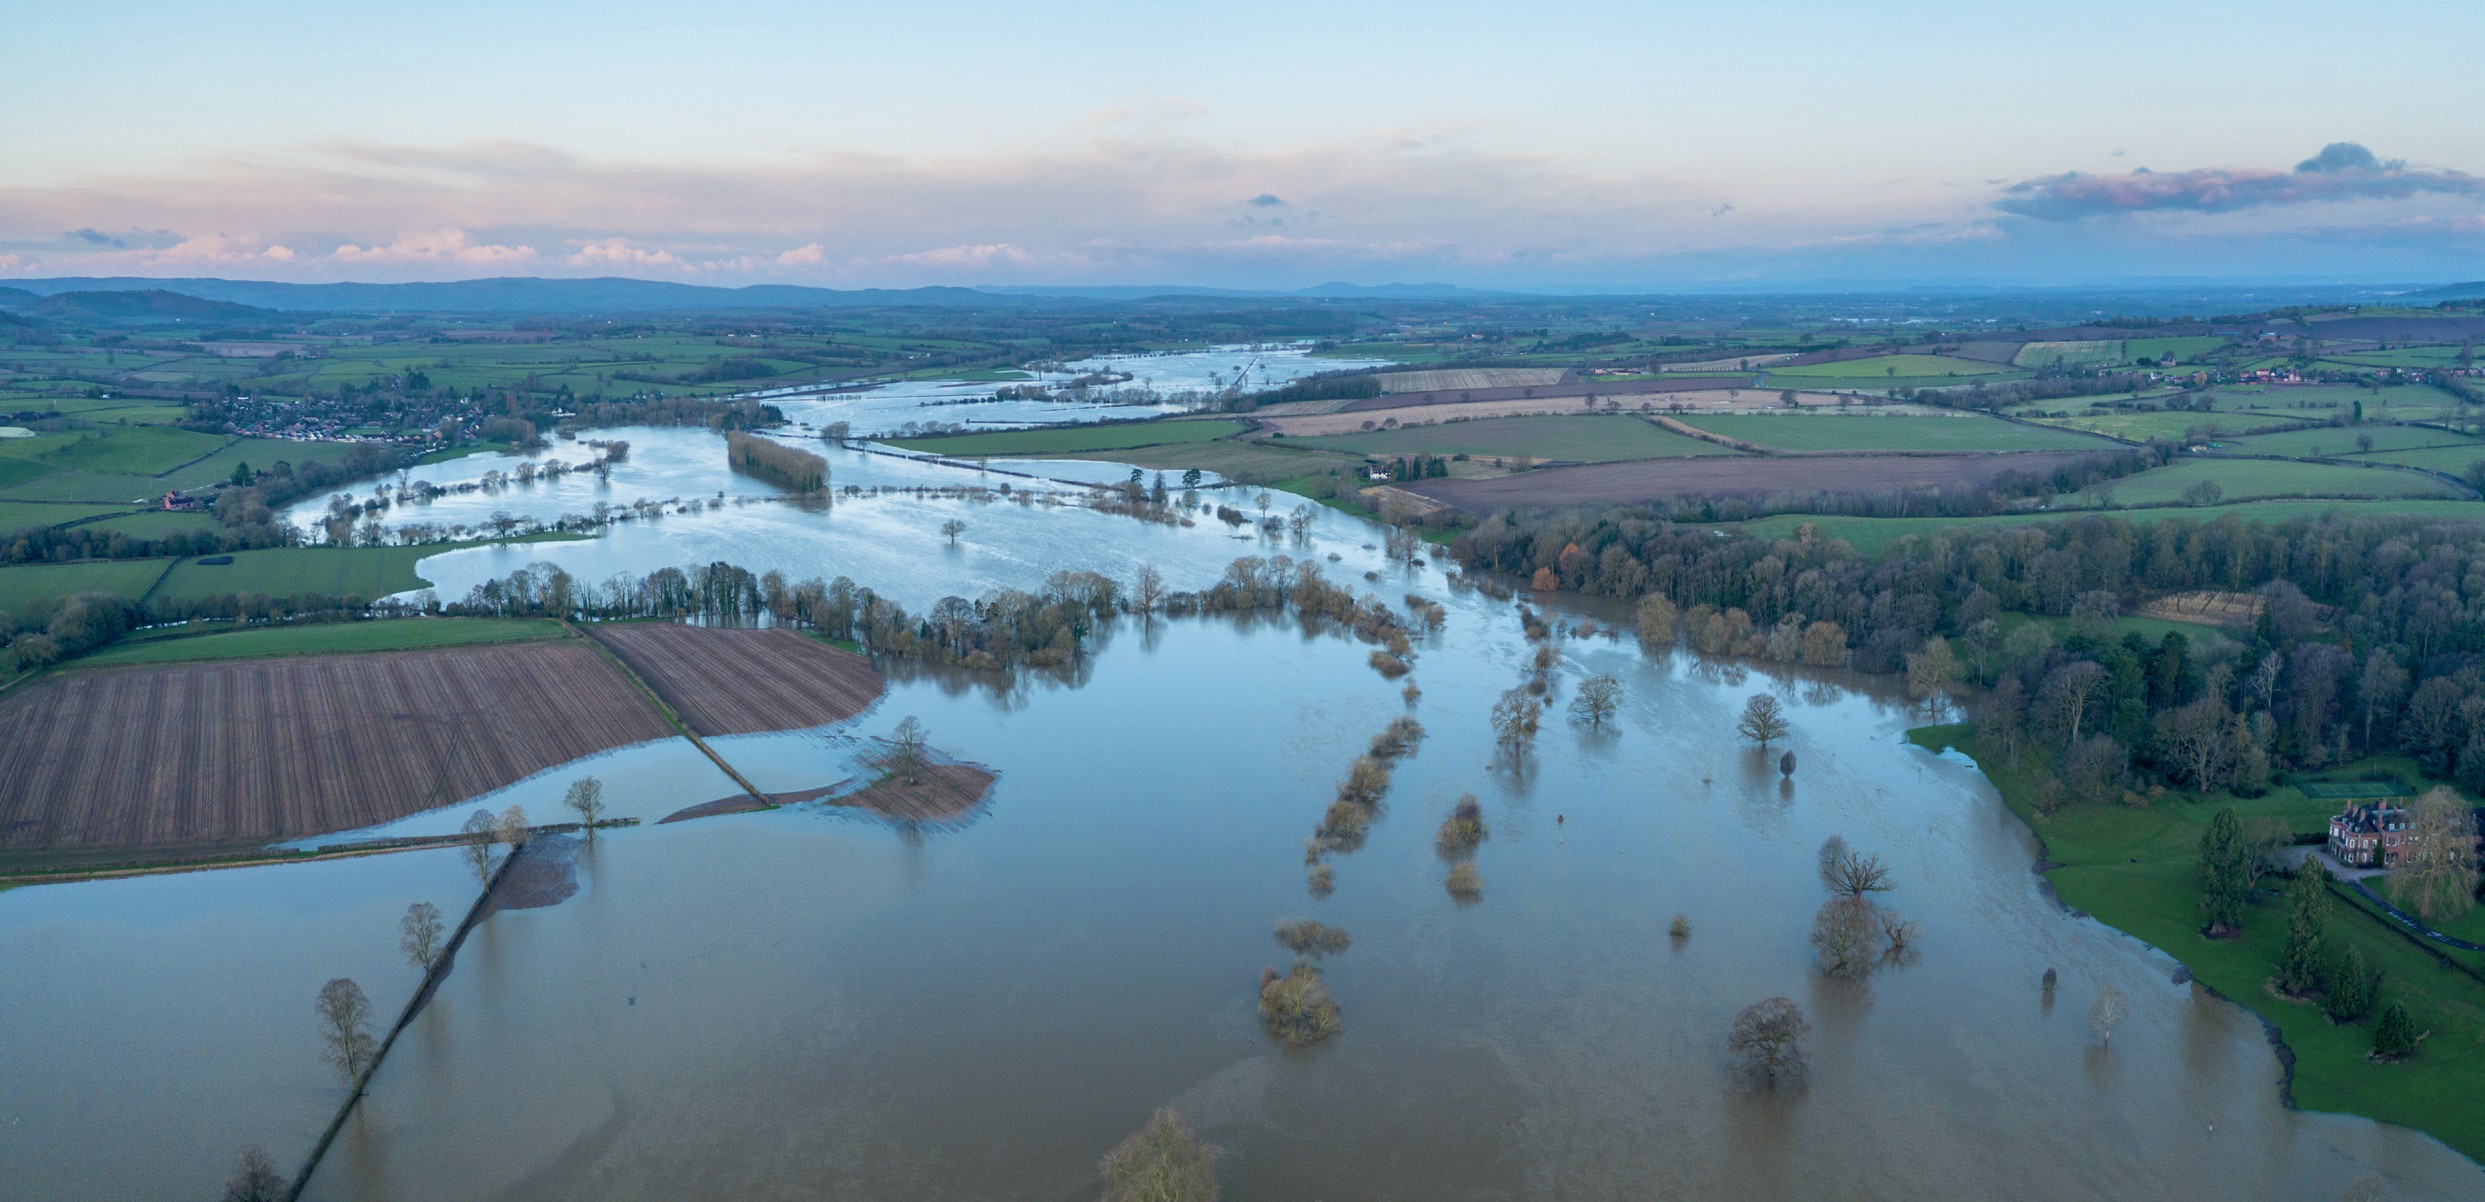
River Severn in flood in Shropshire
Hydrographs show the flow of water in a river (the discharge) over a period of time and are used to investigate flood events by illustrating how a river is affected by rainfall.
To do this, the hydrograph shows two types of data. The bars show precipitation measured in millimetres and the line shows the discharge measured in cubic metres per second (cumecs). This data is plotted against time, usually shown as hours or days.
Your organisation does not have access to this article.
Sign up today to give your students the edge they need to achieve their best grades with subject expertise
Subscribe