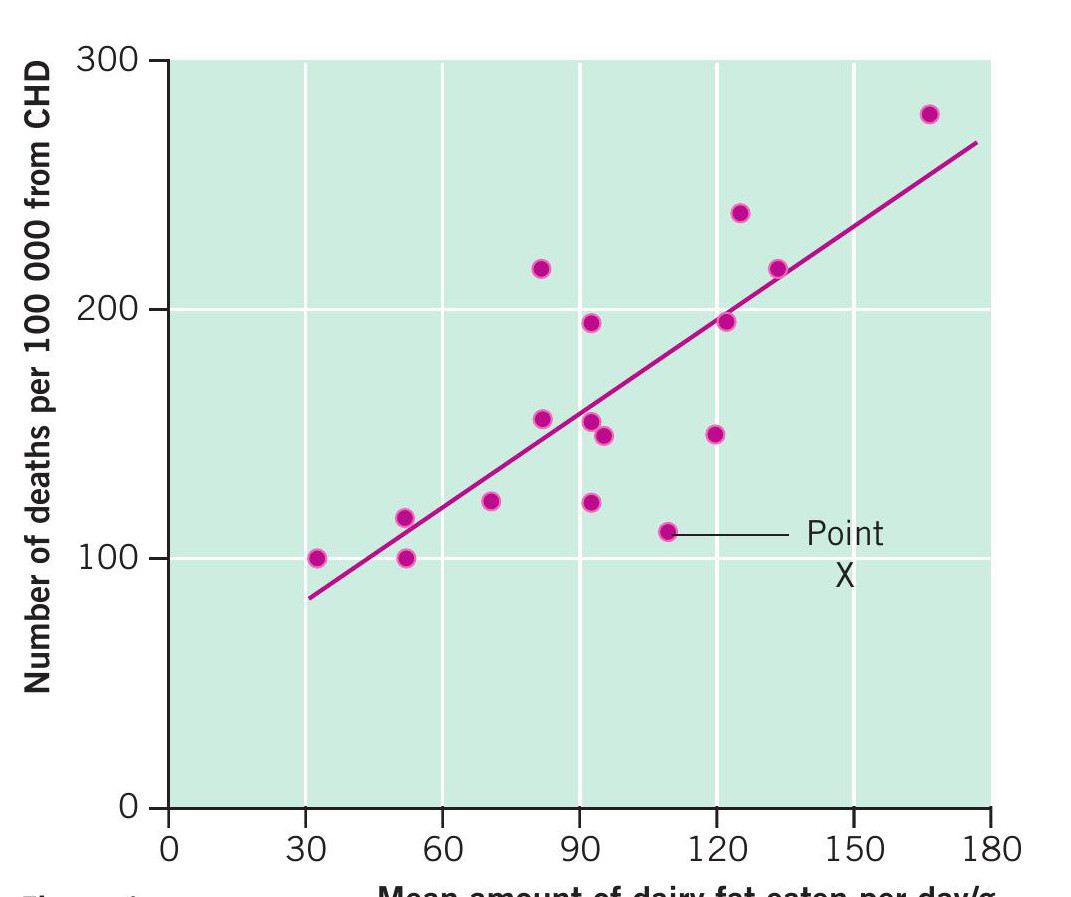
Figure 1 Mean amount of dairy fat eaten per day/g
Graphs
Unit test
Your organisation does not have access to this article.
Sign up today to give your students the edge they need to achieve their best grades with subject expertise
Subscribe
Upgrade: Upgrade covers practical and important issues relating to learning, revision, exams and your performance in them. Improve those grades!
Graphs
Unit test
Sign up today to give your students the edge they need to achieve their best grades with subject expertise
Subscribe
Sociology Review

Biological Sciences Review
Biological Sciences Review

Economic Review