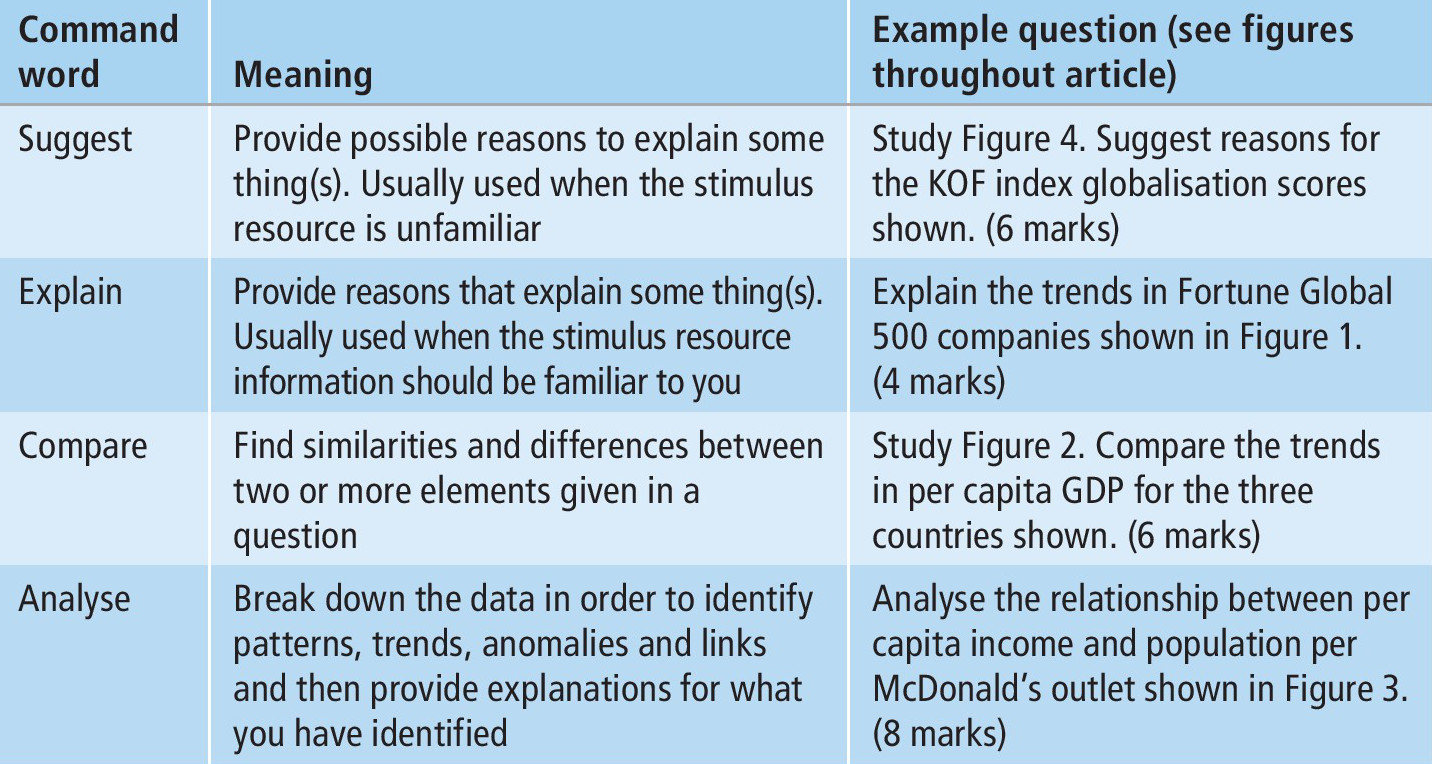
Table 1 Data-stimulus question command words
Note: AQA does not require explanation for its AO3 questions involving the command ‘Analyse’. This would also mean that the second paragraph in Tricia’s answer would not be valid for AQA.
Data-stimulus questions usually use specific command words (see Table 1). At A-level the command word ‘describe’ — which means ‘say what you see’ — is not normally used. However, part of any successful answer will be some description because you need to quote data from the graph and refer to the graph continually throughout the answer.
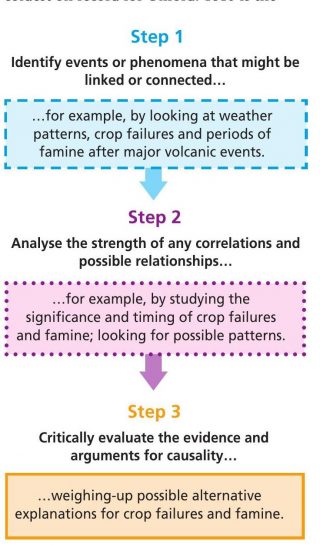
In the exam, the temptation is to start writing your answer as soon as possible, but there are good reasons to pause and look carefully at the graph. Try to do the following before you begin your answer:
Your organisation does not have access to this article.
Sign up today to give your students the edge they need to achieve their best grades with subject expertise
Subscribe