Carbon dioxide (CO2 ) is a colourless, odourless greenhouse gas. Before the industrial era the concentration of carbon dioxide in the Earth’s atmosphere was fairly stable — at least for the last 11,000 years or so since the end of the last glacial period. Ice core records show that the natural background concentration is around 270–280 ppm for an interglacial period.
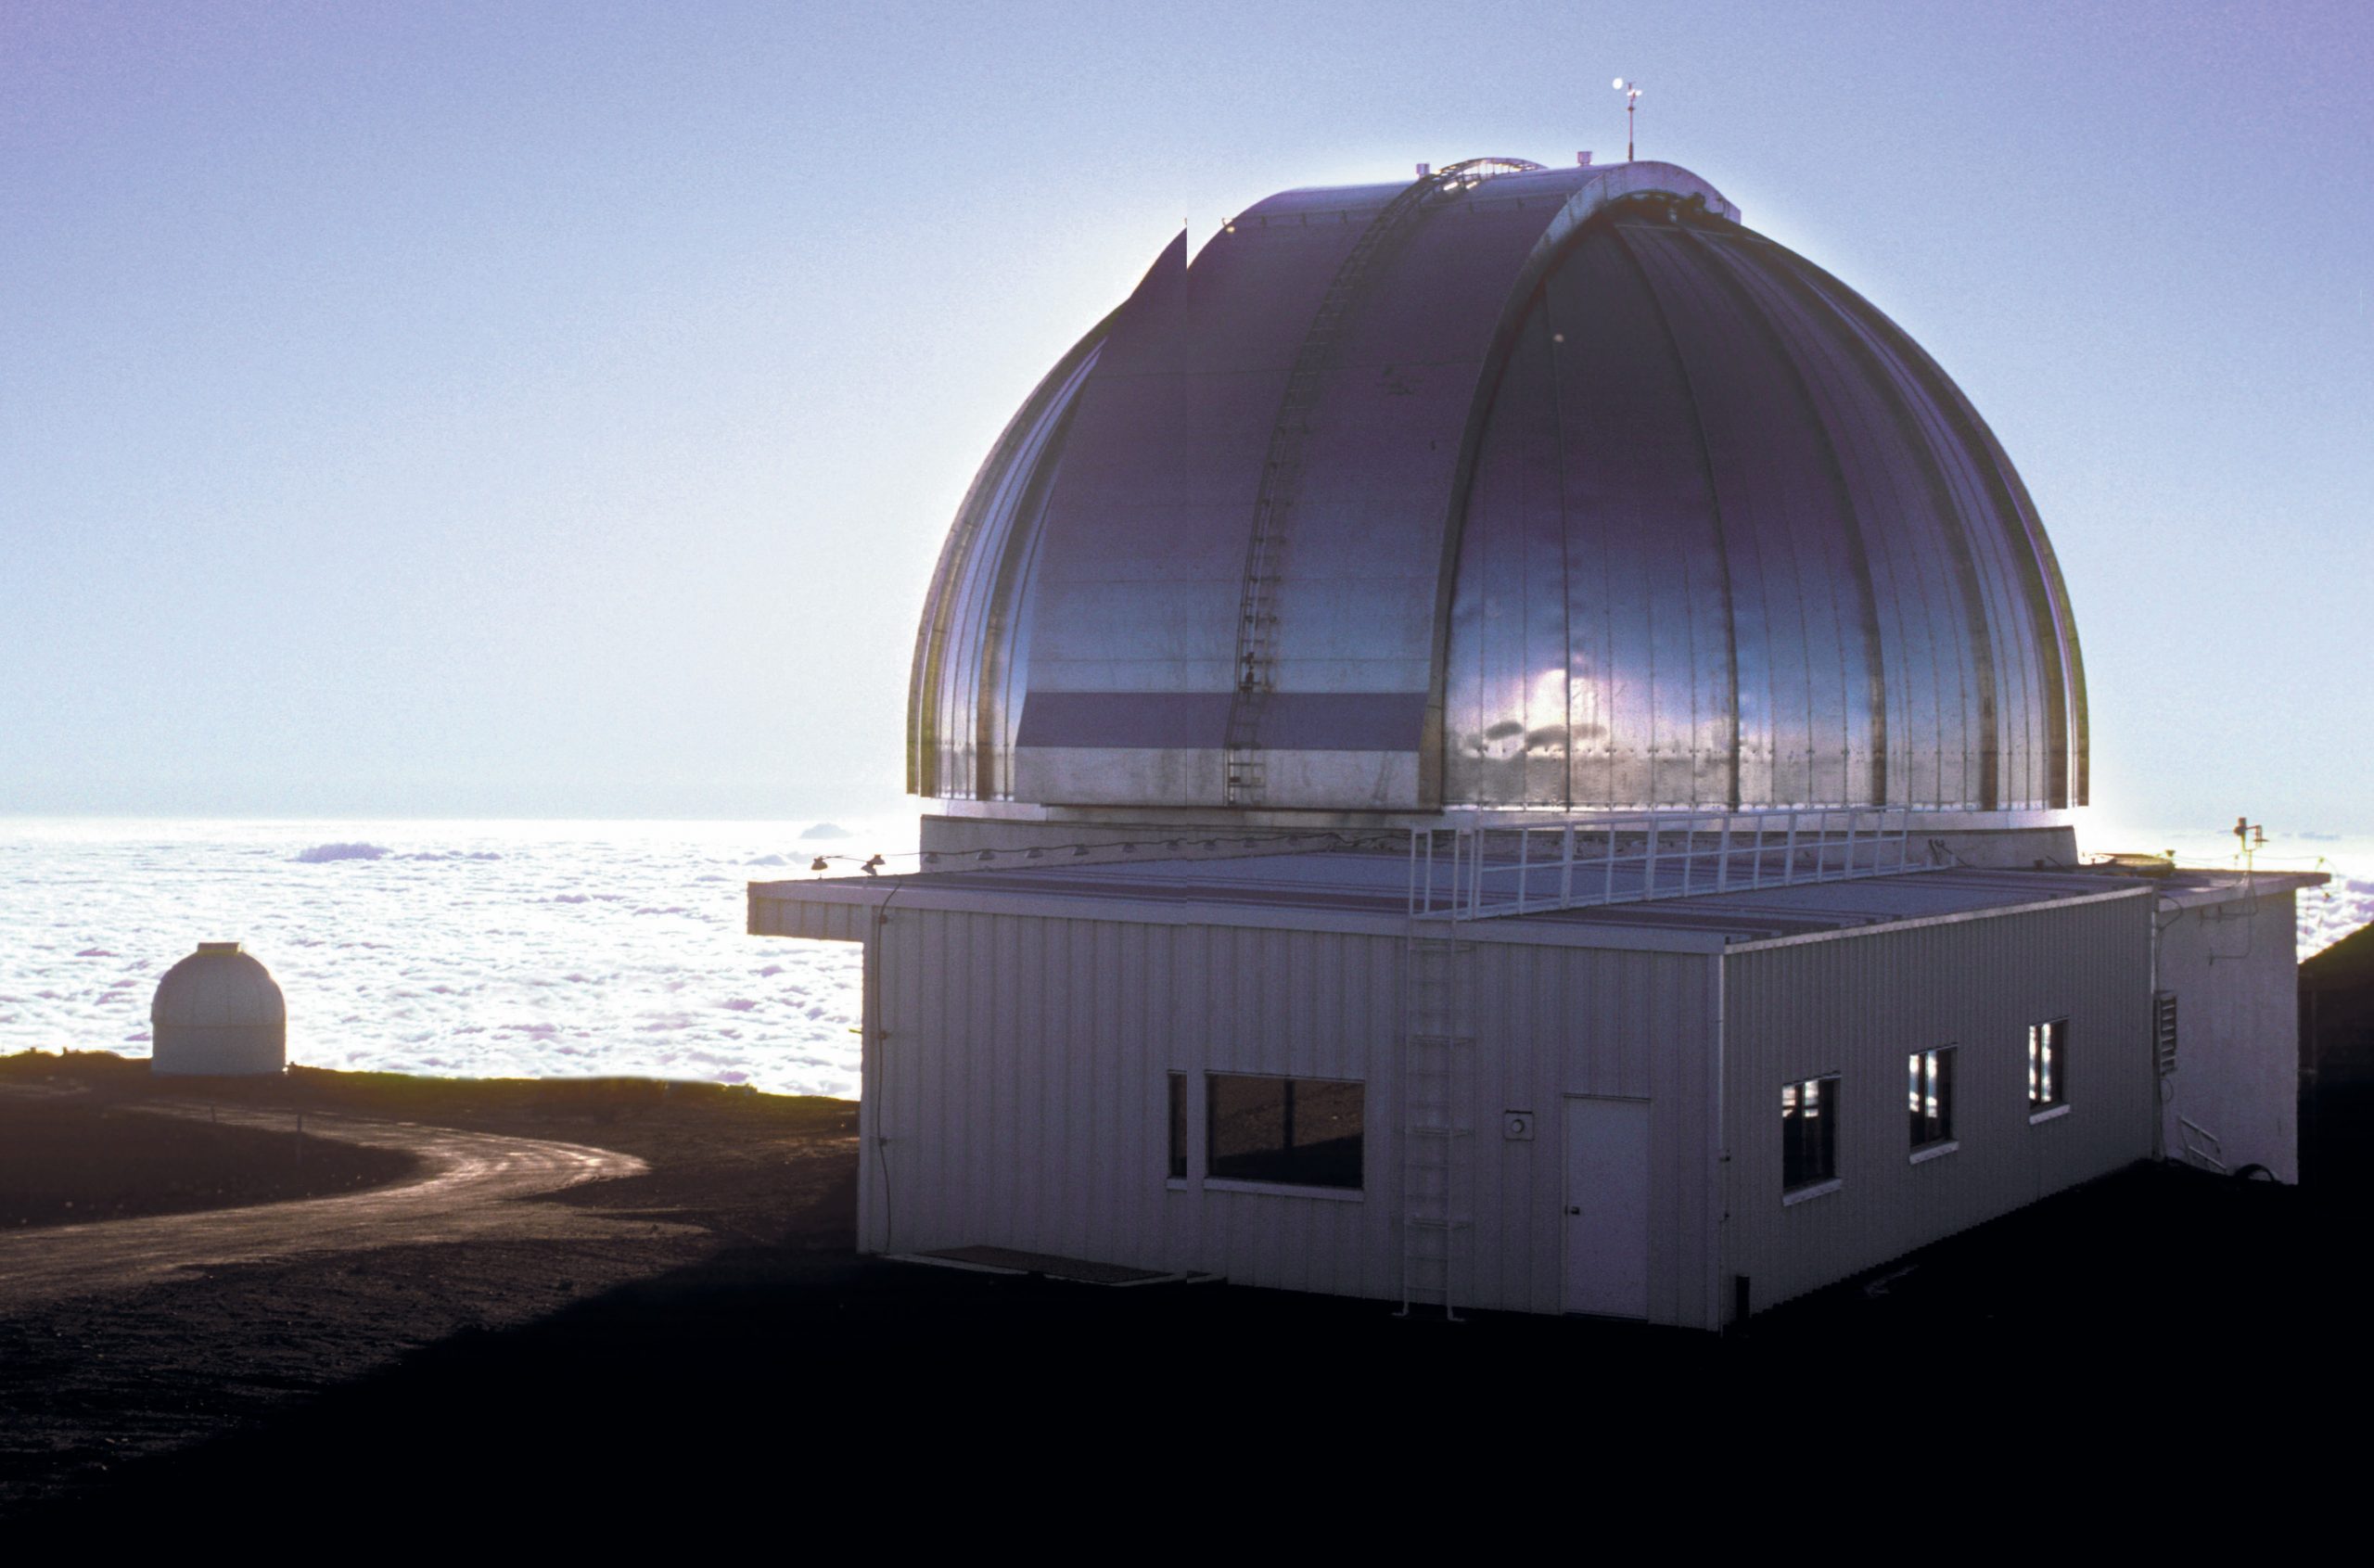
Direct measurements of atmospheric CO2 began in 1958 at the Mauna Loa Observatory in Hawaii. Daily recordings of CO2 at this observatory are maintained by the Scripps Institution of Oceanography at UC San Diego. The record is named for Charles Keeling, who pioneered this research and took the first measurements in 1958. He maintained the measurements for some five decades until his death in 2005 (Figure 1).
Your organisation does not have access to this article.
Sign up today to give your students the edge they need to achieve their best grades with subject expertise
Subscribe