Monitoring tectonic processes from space
This article considers the significant role of satellite monitoring in the study and mitigation of tectonic hazards

Nearly 1 million people have died as a result of earthquakes in the last 20 years, and hundreds of thousands of people have been evacuated from their homes due to volcanic activity. Across the planet, natural hazards continue to turn into disasters.
Scientists in the UK’s Centre for the Observation and Modelling of Earthquakes, Tectonics and Volcanoes (COMET) are at the forefront of international efforts to observe and monitor our hazardous planet from space. COMET scientists are now providing critical information to decision-makers around the world so that they can prepare for and quickly respond to earthquakes and eruptions.
The potential impact of natural hazards
Dangerous natural events occur all over the world. In 2010, as many as 300,000 lives were lost in a devastating earthquake in Haiti. Approximately 3 million people were impacted by this event: homes collapsed, infrastructure was damaged, and warehouses with lifesaving supplies and equipment were destroyed. In the same year, a volcanic eruption in Iceland caused widespread disruption to air travel in Europe at an enormous cost to society — over £1 billion to the airline industry, alone.
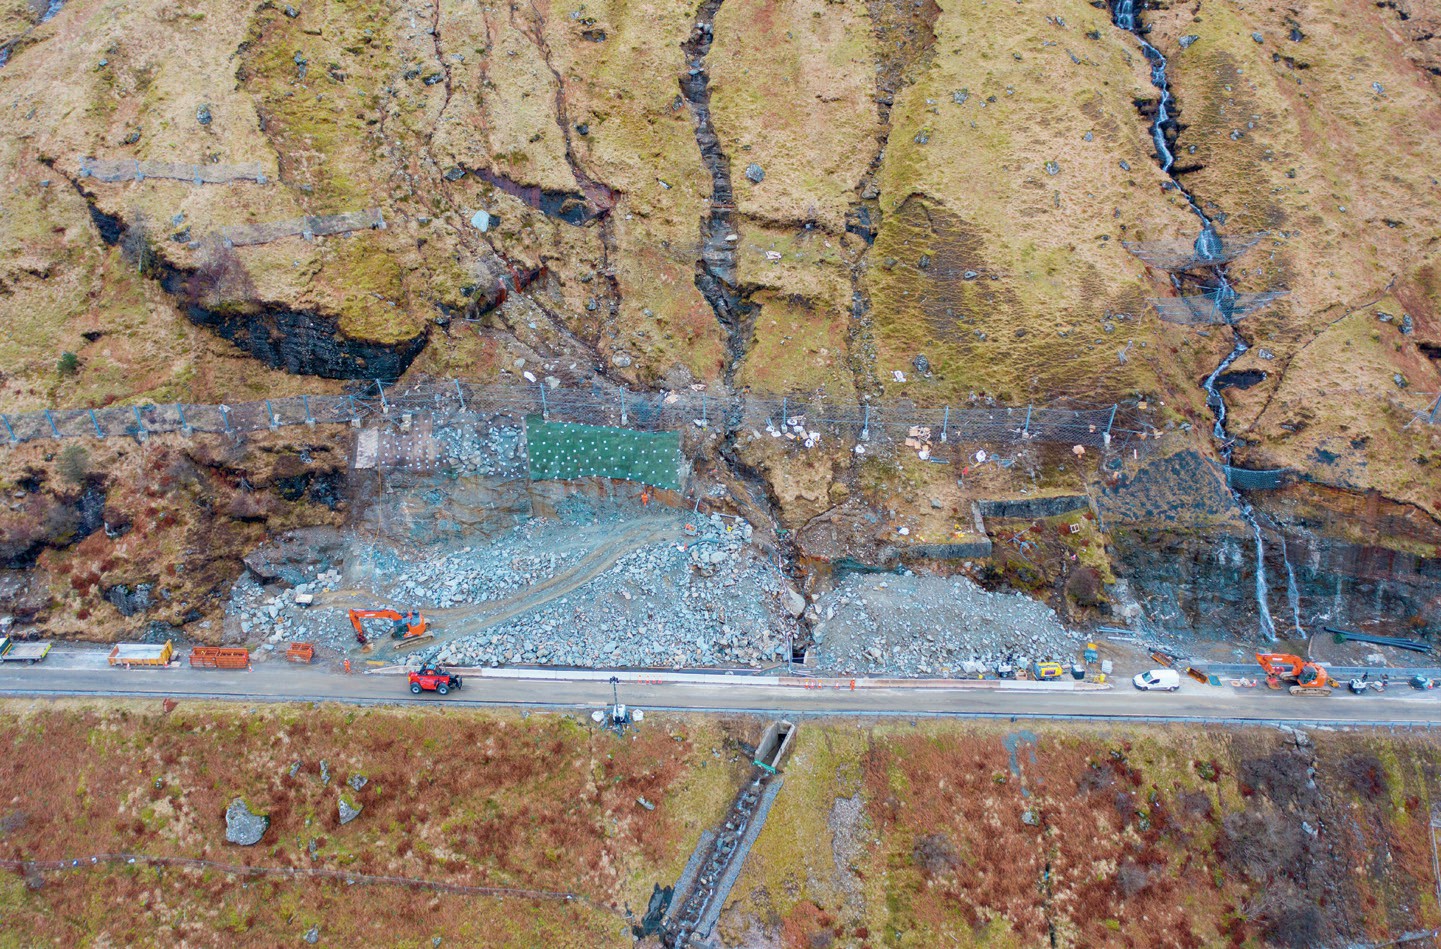
Dangerous geophysical events also occur in the UK. A large sinkhole recently opened under a branch of Sainsbury’s in Yorkshire, for example, and three people were killed in Scotland in August 2020 when a landslide derailed a train.
Box 1 How does InSAR work?
A satellite, which flies 500–600 km above the Earth, sends radar waves down to the ground. There are around 30 million of these waves between the satellite and the ground and they have a wavelength of about 6 cm. Every time the satellite flies around the Earth, it sends waves down and measures the reflections. If the reflection takes longer to bounce back than it normally does then the distance between the satellite and the ground has changed. This happens when the Earth moves, like in an earthquake or before a volcano erupts.
Although we don’t know the precise distance between the satellite and the ground in terms of the total number of wavelengths, we can measure very small changes in the position of the Earth extremely precisely using this technique.
Any changes in the distance between the satellite and the Earth is shown in coloured maps called interferograms. Every time we go through a cycle of these colours, the distance between the satellite and the ground (and back again) has changed by one whole wavelength.
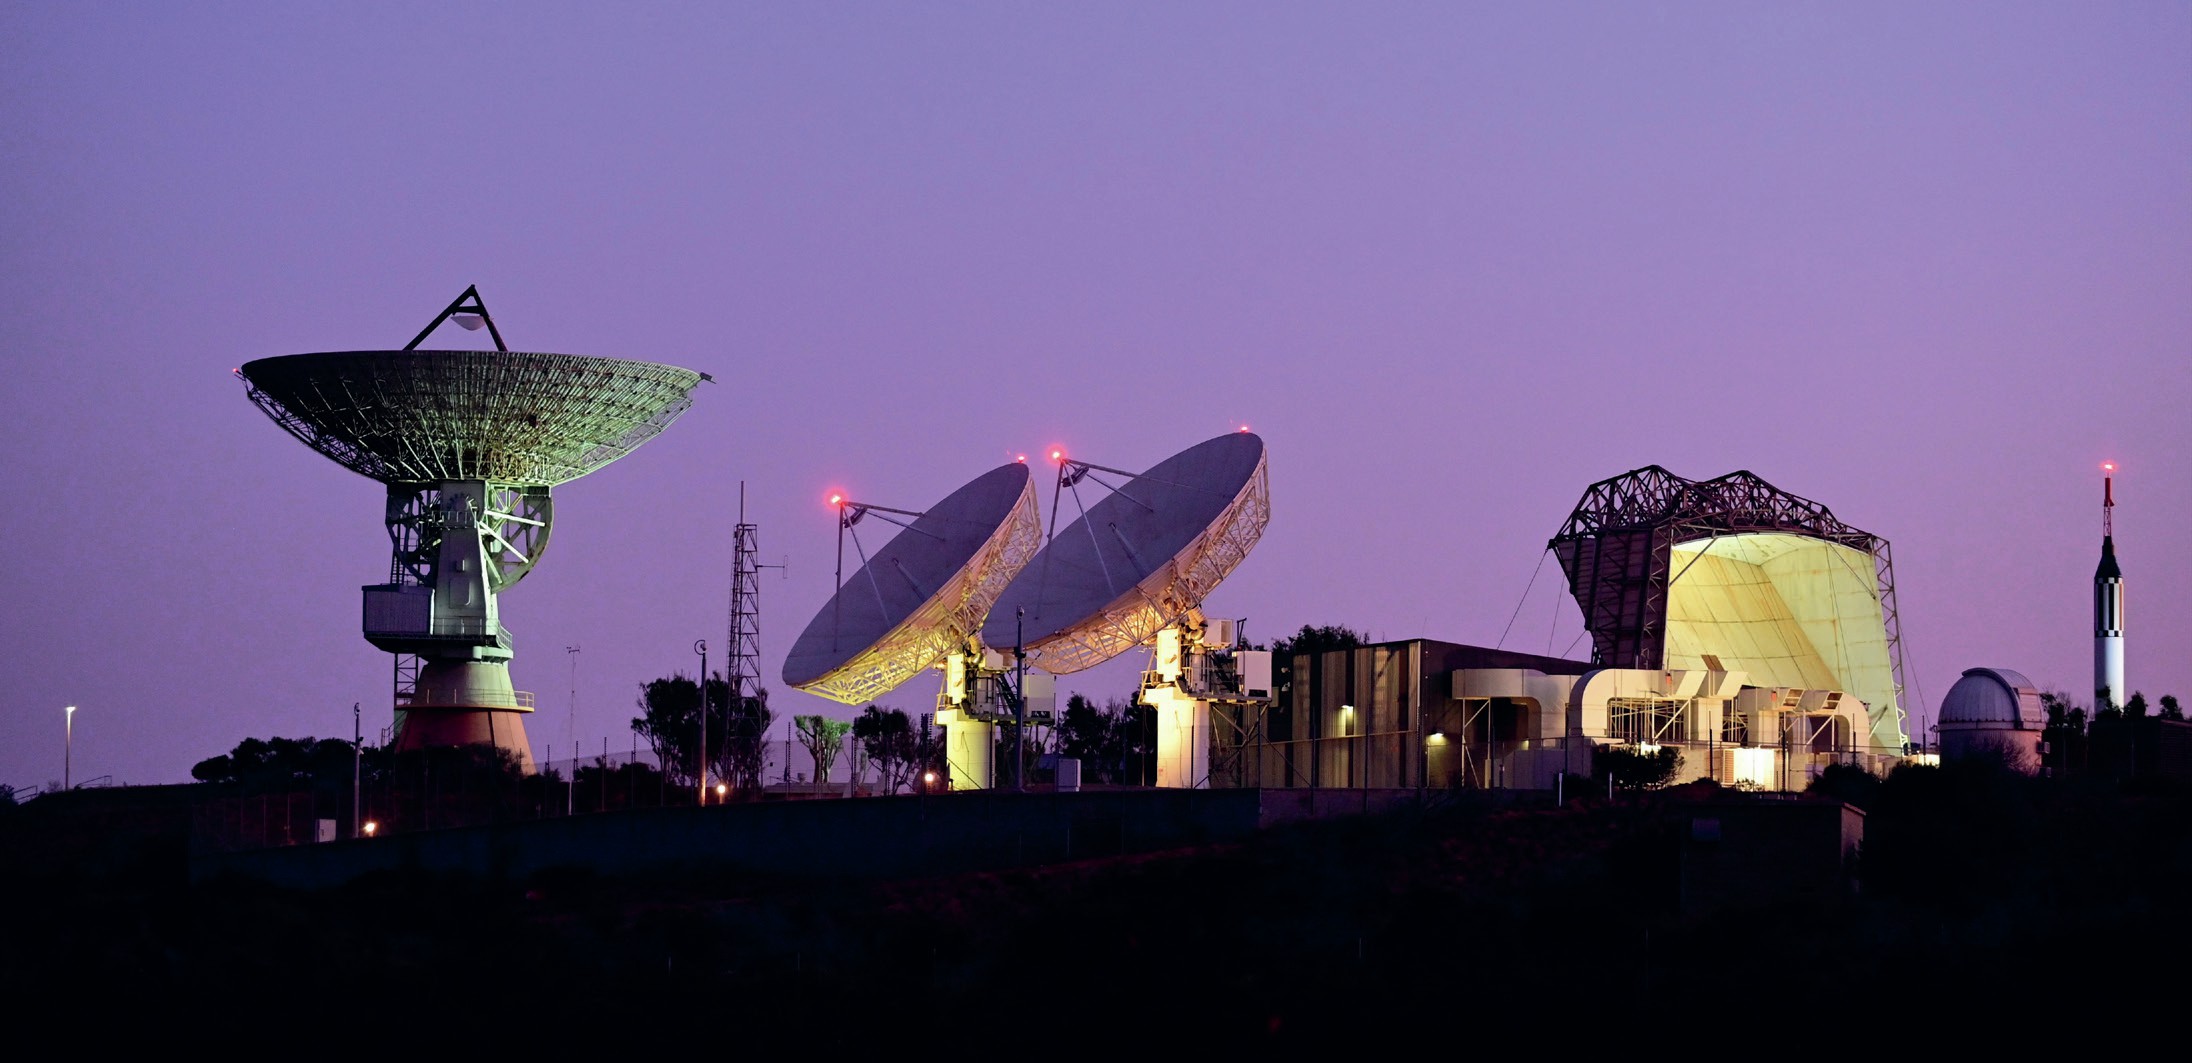
Satellite Earth observation
Satellites can now detect very small changes on the Earth’s surface and, by regularly gathering and analysing this information, we can help to reduce the impact of natural hazards. One technique we use to measure ground movement is called Interferometric Synthetic Aperture Radar (InSAR). Using information from InSAR we can more accurately estimate where the strongest shaking occurred in an earthquake, for example, or when a volcano is showing signs of unrest that might lead to a future eruption. See Box 1.
The Sentinel-1 satellite constellation, funded for 20 years or more by the European Commission and operated by the European Space Agency (ESA), is a game changer for InSAR. Sentinel-1’s two polar-orbiting satellites are the first truly operational radar satellites: they send radar out to image large areas day or night, work in all weathers and can even see through clouds. The Sentinel-1 satellites consistently gather data from the whole planet at least twice every 12 days, so we are getting a lot of information. The data are completely free and open for anyone around the world to download from ESA (www.esa.int/). Sentinel-1 is specifically designed for InSAR, so it is always in the same mode and captures the same type of information. This might seem like a boring long-term strategy, but it means that we can see how the Earth is moving and changing over a long period of time.

Aren’t there other ways of monitoring the Earth?
When we look at earthquakes, the first information we get for the location and magnitude of an event comes rapidly from seismology. Today, we can do a remarkable job on a global scale by listening to the seismic waves that come from an earthquake. There are a number of organisations around the world that can tell us where an earthquake happened and how big it was — the first location and magnitude information usually comes within just 20 minutes of the event.
Seismic stations tell us where the earthquake started (the epicentre), and give us an idea of how big it was (the magnitude) and how much the ground shook during the event — the more the Earth shakes, the more damage we can expect. Shake maps are provided by seismologists after an earthquake, which provide an estimation of how much the ground might have been shaken. More and more information about the earthquake can be gathered as time passes, so the initial shake map is usually refined to provide a more accurate picture of what might have happened.
Why do we need satellite data?
Shake maps produced from seismological data are very useful but they also give us quite a blurry, low-resolution version of what happened in an event. Satellite data allow us to map ground movement over a large area to provide accurate and clear information for the event.
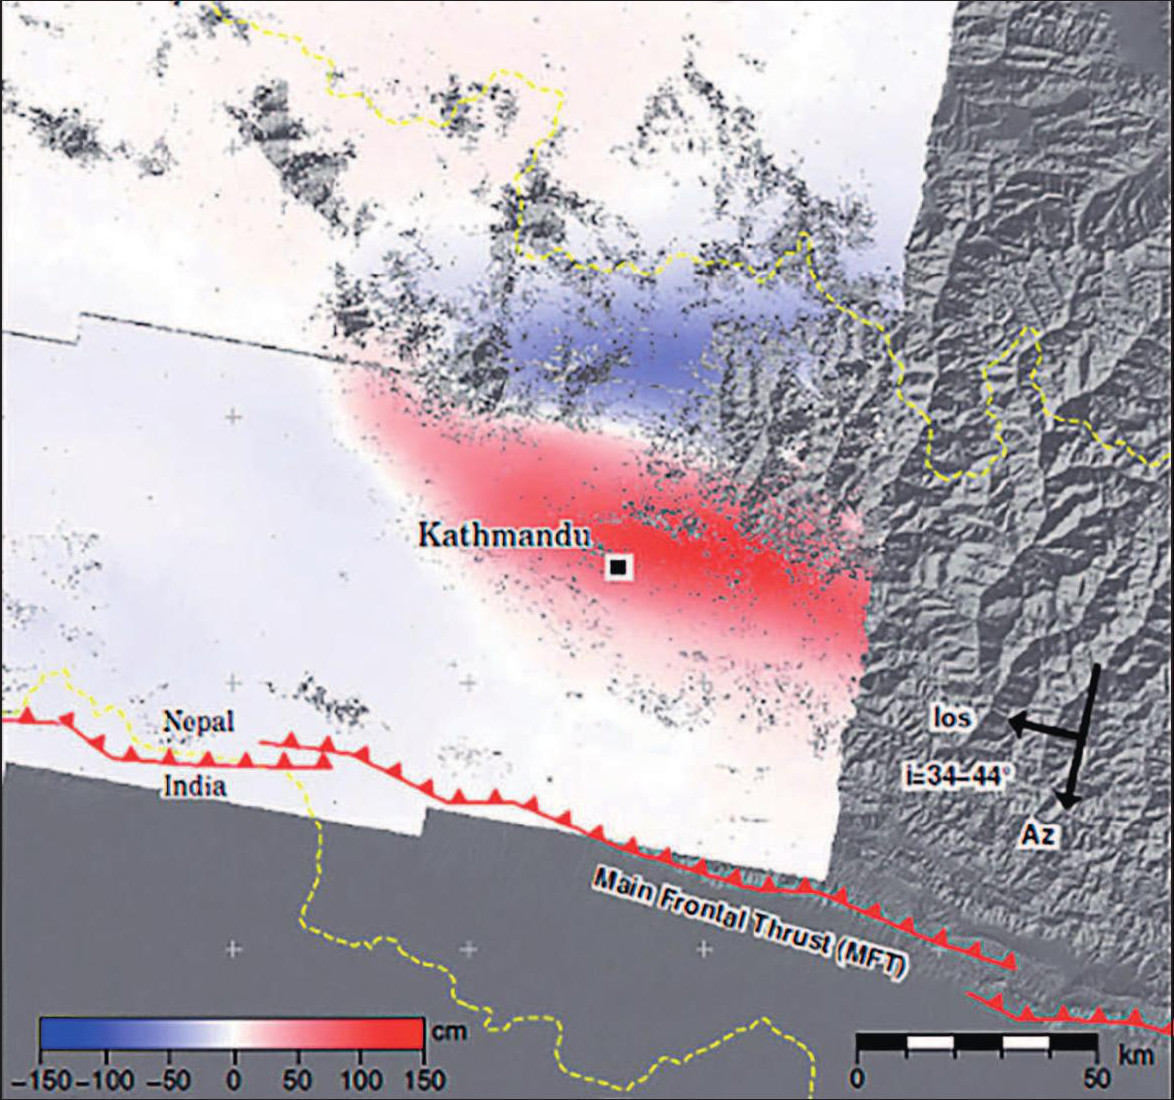
It is also important to quickly find out where the epicentre of an earthquake is using seismology. However, earthquakes commonly result from a large patch of a fault slipping rather than coming from one point in the ground. In Nepal in 2015, for example, a fault that was around 150 km long slipped in a major event that caused around 10,000 deaths. See Box 2 and Figure 1. Using satellites, we can examine the geography of land surface deformation to accurately establish which faults slipped and by how much.
Seismology can also occasionally get the solution for an earthquake completely wrong. The large New Zealand earthquake in 2016 was very interesting for this reason. From analysis of the initial seismograms, scientists were expecting that a deep fault underneath the south side of New Zealand had slipped. When we received the InSAR satellite data within a couple of days of the earthquake, what we found was astounding — there was an incredibly complex pattern of large ground movements across a complex network of faults, moving by as much as 6 m. When that information was used to update the shake map from the information provided by seismology, a completely different solution for the earthquake was revealed.
Box 2 What actually happens in an earthquake?
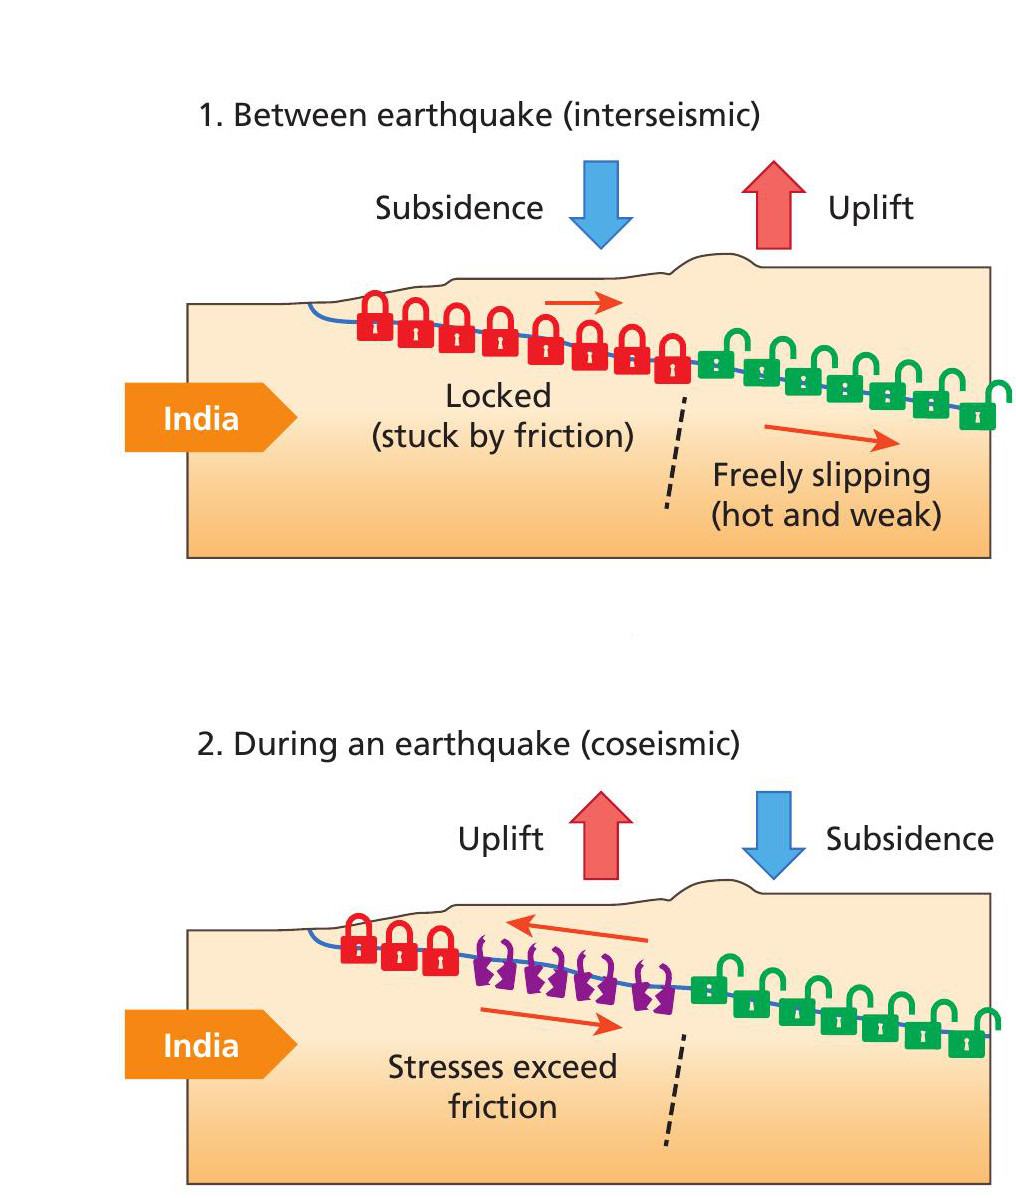
In the case of the Nepal earthquake, the Indian plate is moving northwards and colliding with Eurasia at around 40 mm per year. This creates the Himalaya mountain range but also a massive collision zone ahead of the Himalayas: the Tibetan plateau. The motion that is taken up by squashing the Himalayas is around 15 mm every year along the fault. The Indian plate moves underneath the Eurasian plate, and while the lower part of the plate easily moves forward, the top parts of the plates are stuck together. Between earthquakes, friction holds the two plates together and the slow push from one side lifts and bends the ground above. The stresses build up until the locked part of the plates breaks and moves back. When the stress on the Earth becomes too high, the fault slips and releases the pressure. That causes the Earth to shake, and also causes a characteristic pattern of uplift and subsidence that we can use to work out what happened on the fault beneath the surface (see Figure 2).
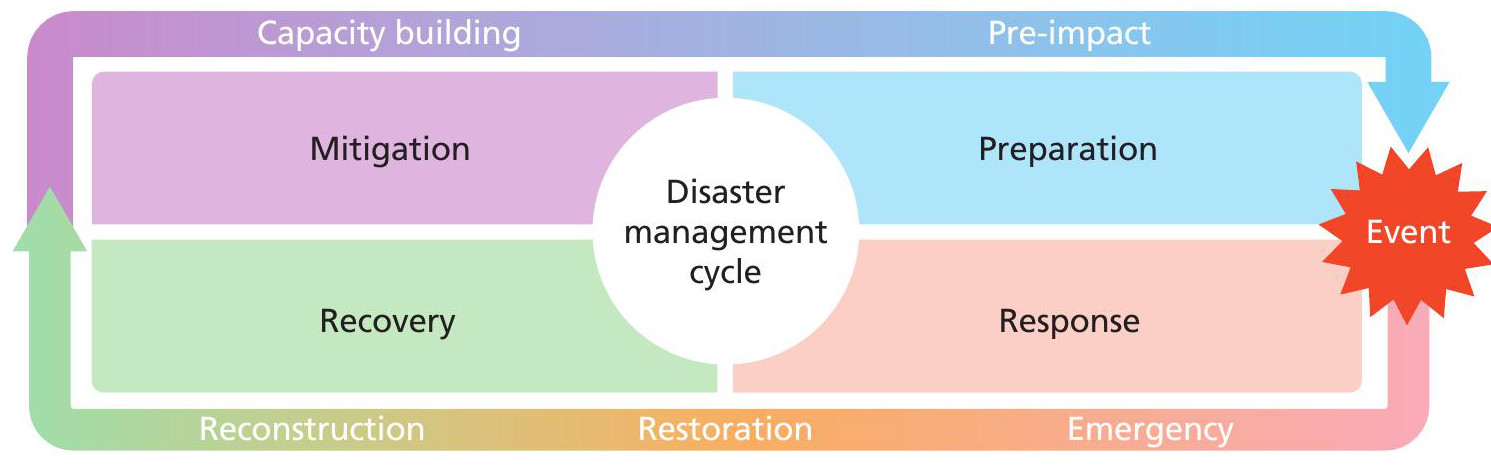
Satellites and the disaster management cycle
Data collected from satellite Earth observation is now used at all stages of the disaster management cycle. Disaster management can be thought about in four distinct phases: the sequence starts with an event, such as an earthquake or a volcanic eruption, followed by a response to the event and a recovery period, before moving on to mitigation and preparation for another event. See Figure 2.
Response
Using information from satellites, we can provide a much more detailed and reliable prediction of which areas are likely to have been damaged in an earthquake or volcanic eruption. This helps rescue teams on the ground to know where to focus their efforts.
We can also use the data to assess whether an event is over or not. Volcanic eruptions, for example, aren’t usually single events like earthquakes, so it can be difficult to know when the immediate danger has passed.
Recovery
When we go into the recovery phase, we start to think about the assessment of ongoing hazard. We can use the satellite data to inform how we might rebuild the area to reduce the impact of another event. Information from seismology alone might show a large area of low-intensity shaking, but satellite data can pinpoint where shaking was stronger and more intense. This can help decision-makers to decide where and how to rebuild towns more safely, for example. We can now find out what happened in earthquakes in great detail, within just a few days of the event, using data retrieved from satellites.
Preparation and mitigation
In the preparation and mitigation phase, we are thinking about using satellite data to assess the long-term hazard and find better ways to manage it. The information we were able to gather from the 2016 earthquake in New Zealand is changing seismic hazard models worldwide, which will help us to better understand hazards in areas like Los Angeles where complex multi-fault ruptures could happen again.
One of the worrying things that satellite data showed after the Nepal earthquake was that the shallowest parts of the fault beneath the country didn’t slip, so it is still locked and building up stress. At some point we are expecting another large earthquake near Kathmandu as it sits on the boundary of this slipping patch and the locked patch.
Before an event, we monitor any unrest or movements on the Earth from space. We might be able to detect early signs that a volcano is about to erupt, for example, if the ground around the volcano shows signs of bulging.
Forecasting events
Rather than just responding when a natural hazard occurs, we would like to monitor the behaviour of all volcanoes and all fault zones to help us forecast possible hazardous activity before it happens.
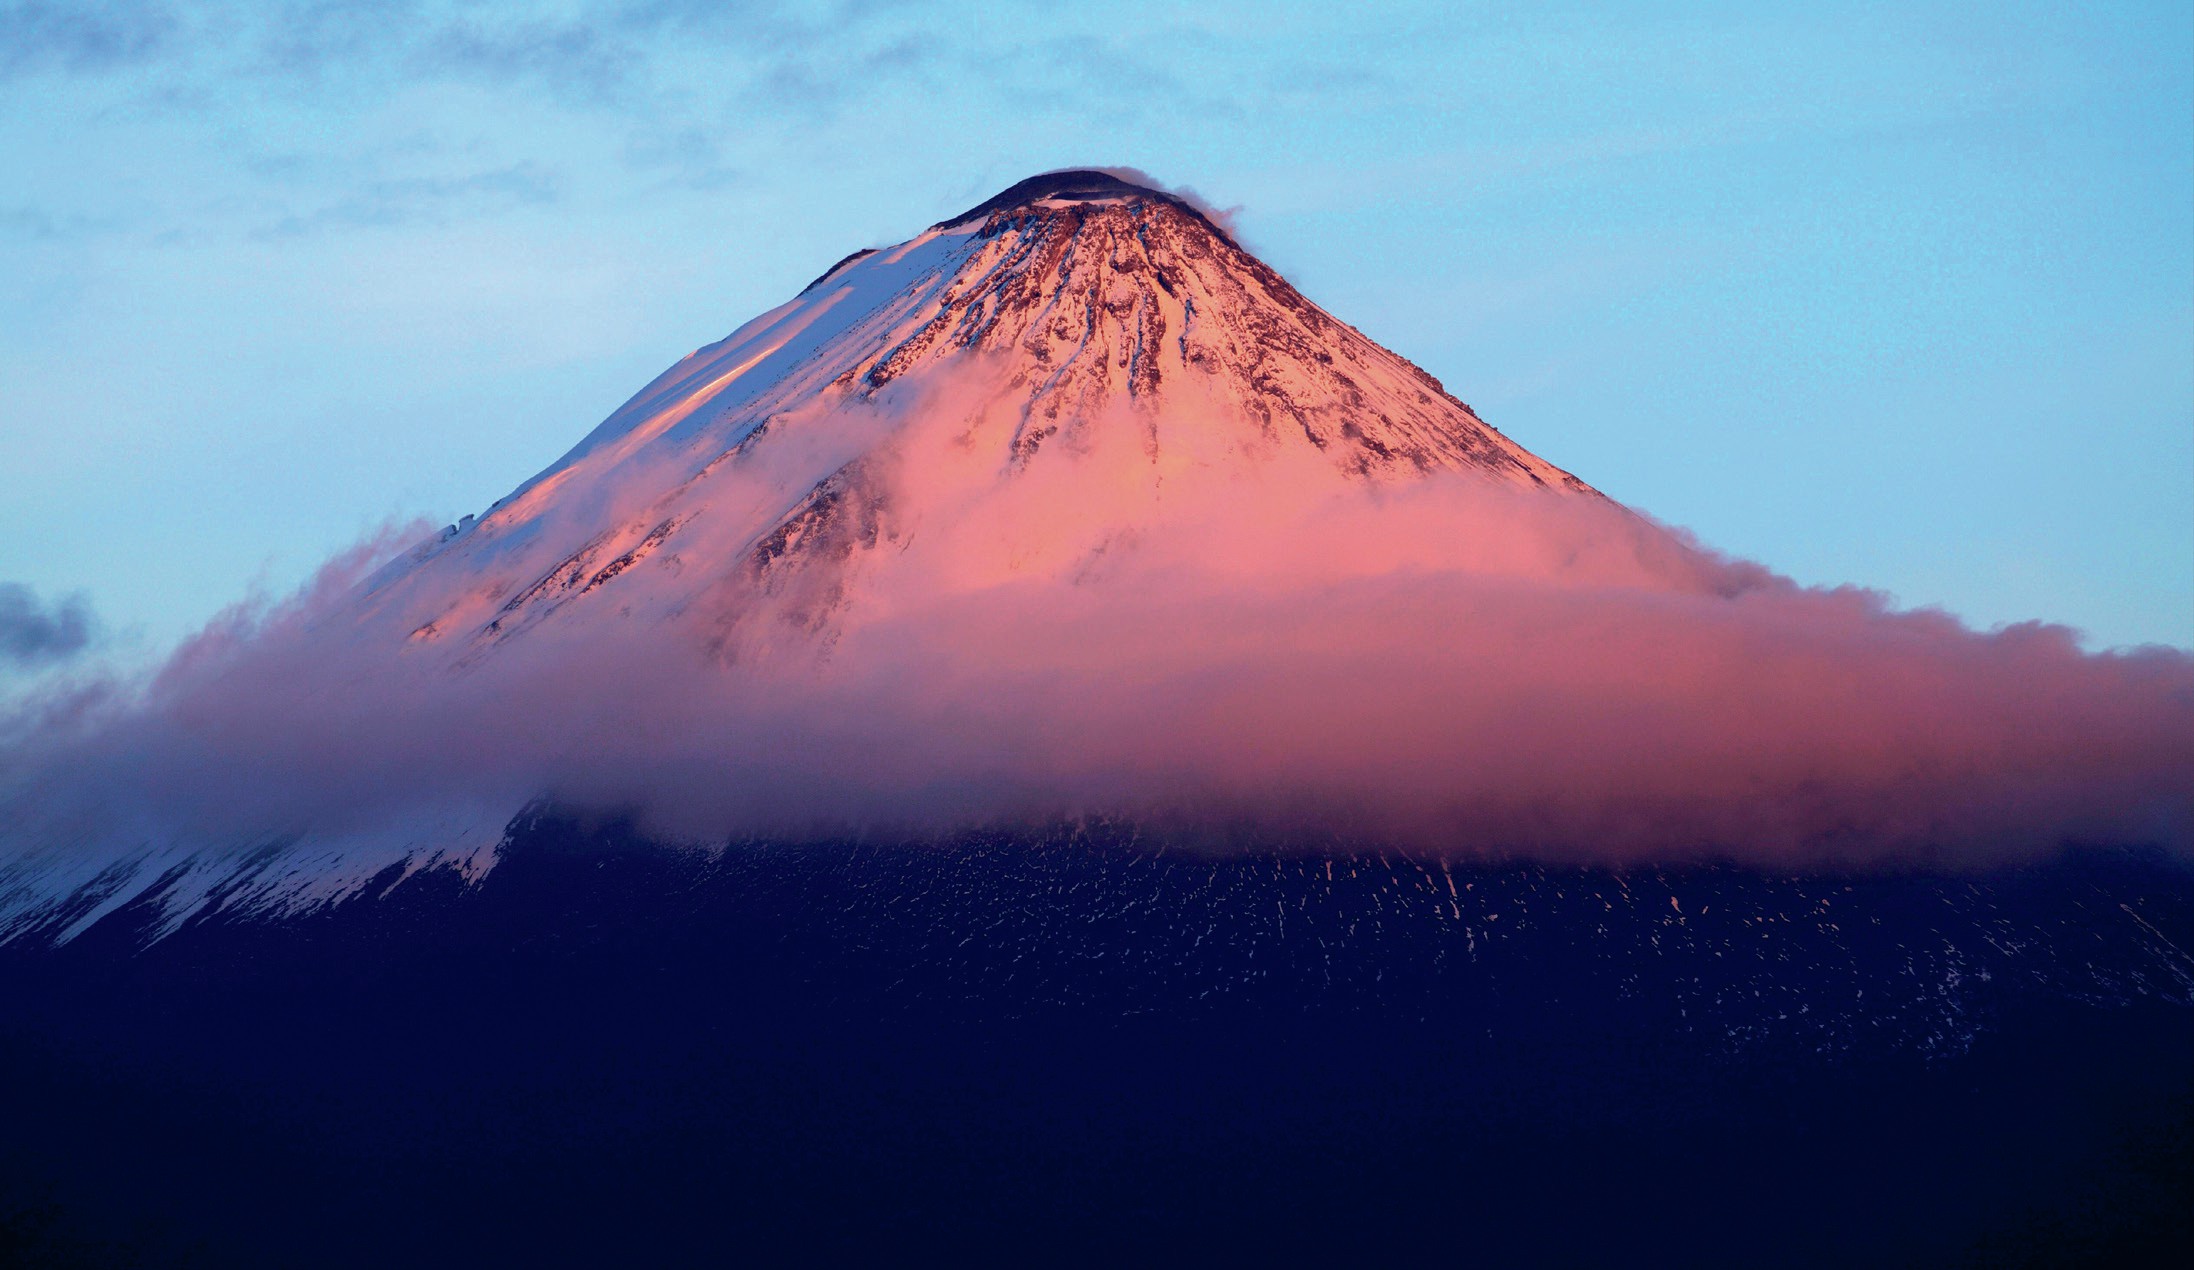
Deformation at volcanoes is useful as it is diagnostic of impending eruption or unrest. Sangay Volcano in Ecuador, for example, experienced around 30 cm of uplift between 2017 and when it erupted in September 2020. Scientists at the Instituto Geofísico in Quito, who are responsible for monitoring Sangay and all the active volcanoes in Ecuador, are now using satellite data routinely — this is particularly valuable for volcanoes that lack ground-based instruments. Scientists in COMET in the UK are also building a volcano deformation portal (www.tinyurl.com/y4jdx5m2) where you can look up any volcano in the world and look at ground movements around that volcano.
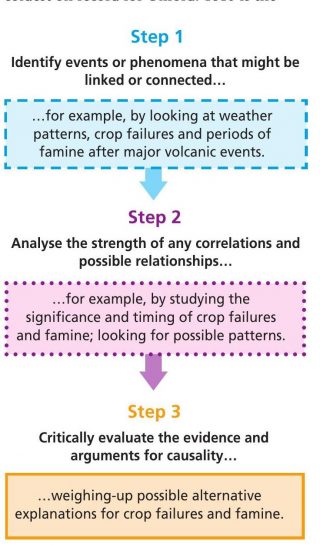
Earthquake faults can be more challenging. We don’t know where all of the faults are located and earthquakes often seem to happen without any short-term precursory signals. For the faults we are aware of, we can map how much the Earth is bending (strain) with InSAR. Scientists have found that the strainrate correlates with earthquake rates and it seems that this is a causative relationship: the higher the strain-rate, the more chance there is of an earthquake. However, we need to be able to measure the strain rate incredibly precisely for this to be useful. By using hundreds of radar images, we can now estimate how much the Earth is deforming and show areas that are at risk of hazardous events.
We are also able to help forecast when an event is unlikely to happen. In response to a request from Instituto Geofísico in Ecuador in 2017, we looked at one of the Galapagos Islands, Cerro Azul. The satellite data showed that the magma was most likely moving sideways as some of the Earth was sinking and some uplifting. This was part of the evidence that local scientists used in conjunction with decision-makers to lower the alert level, as it showed that an eruption was less likely than previously thought. The volcano didn’t erupt on this occasion.
We are now starting to routinely use satellite data to monitor these very small ground motions and this is starting to change the way we monitor and live with hazards on our planet.
Conclusion
Satellites are used to monitor tiny ground movements with extraordinary accuracy. Understanding these movements can help us forecast where future earthquakes will occur and when volcanoes might erupt. Satellite data can also help us to respond to events that have already happened and prepare for any future hazards.
The No Natural Disasters campaign’s slogan is: ‘Whilst some hazards are natural and unavoidable, the resulting disasters almost always have been made by human actions and decisions.’ The focus now and over the last 5–10 years is to build on international collaborations, such as the ‘Tomorrow’s Cities’ project (www.tomorrowscities.org), between physical scientists, social scientists and practitioners, working with decisionmakers and policy-makers to try and use the scientific knowledge, understand the barriers to the uptake and really try to improve resilience and prevent future natural hazards becoming disasters.
Question for discussion
To what extent do you think that satellite data can mitigate the impacts of future tectonic hazards?
GLOSSARY
Mitigation Taking action to reduce the severity or seriousness of an event.
Seismology The study of earthquakes and seismic waves. Seismic waves are waves of energy that move through the Earth (or other planets) after they are released by sudden ground movements or explosions.
Sinkhole A hole or dip in the ground caused by a collapse in the surface layer of the Earth.
KEY POINTS
■ Satellites provide critical data helping us monitor our hazardous planet.
■ Gathering and analysing this information helps us to respond to dangerous natural events, such as earthquakes and volcanic eruptions.
■ Monitoring the planet from space can also help us forecast future events.