This issue’s Mathskit continues the graphical theme of the previous two by looking at how exponential changes are represented and described graphically. Exponential changes are encountered in A-level physics quite frequently, for example radioactive decay and capacitor charge and discharge. Conversely, in everyday language, and especially news reporting, changes are often described incorrectly as ‘exponential’ when they are clearly nothing of the sort. For these reasons a good understanding of what makes a change exponential is important.
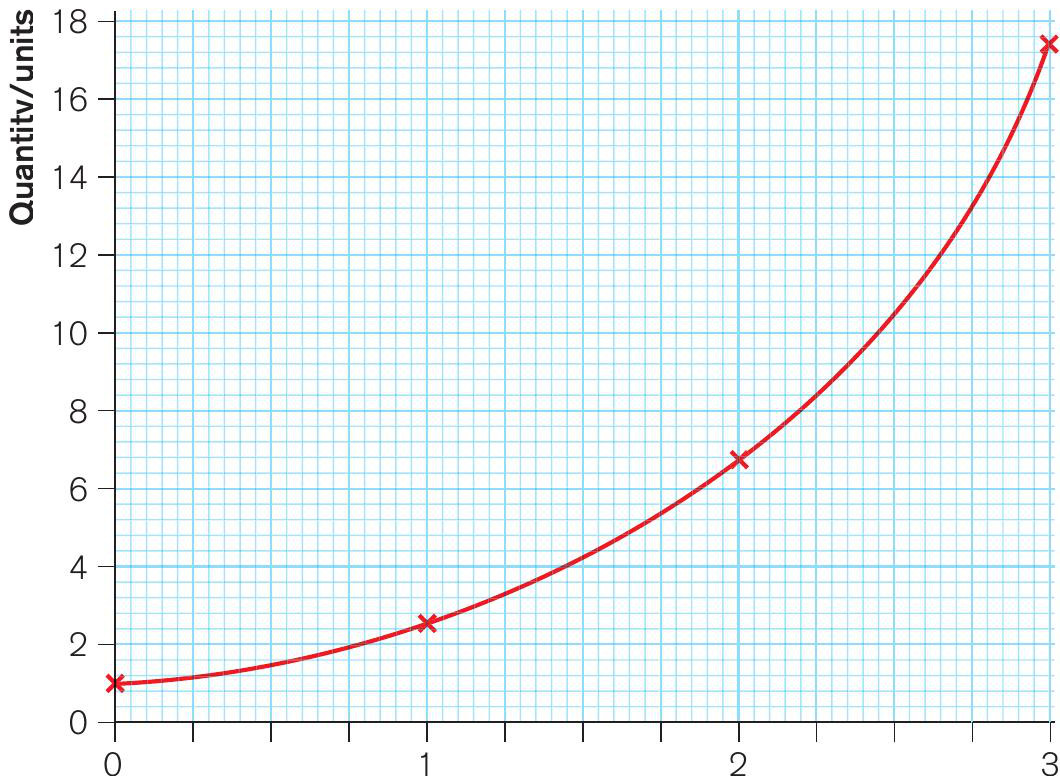
An exponential change is one where the rate of change of the quantity being measured — the gradient of the curve of the graph of the quantity plotted against (usually) time — is directly proportional to the value of the quantity itself. This change can be growth, where both the quantity and gradient increase with time as shown in Figure 1, or decay, where both the quantity and gradient decrease with time as shown in Figure 2.
Your organisation does not have access to this article.
Sign up today to give your students the edge they need to achieve their best grades with subject expertise
Subscribe