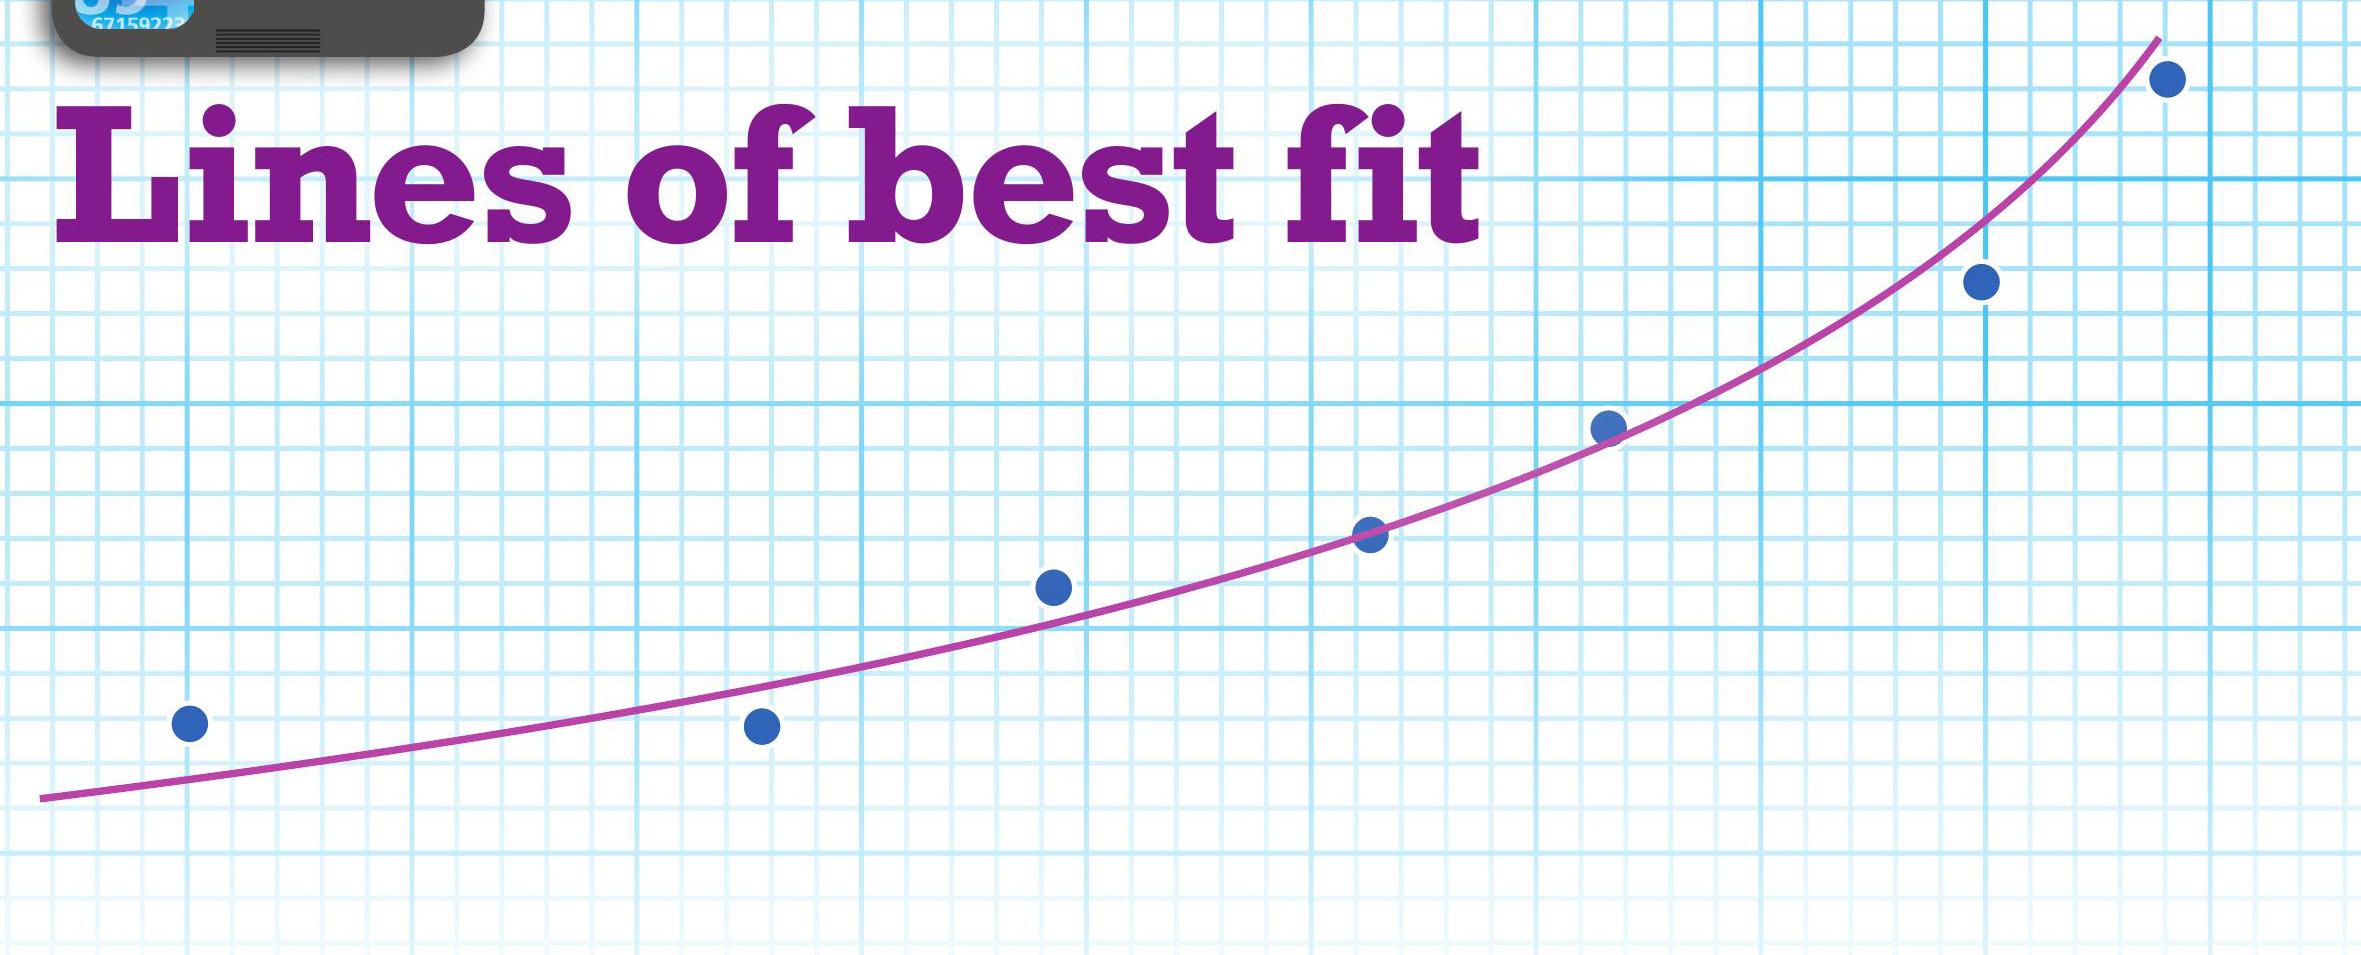
As aphysics teacher I spend a lot of time talking about graphs with my students, and in particular giving advice about lines of best fit. I say ‘advice’ because I refuse to tell them exactly what to do (much to my amusement and their frustration), as this removes the need for them to make their own sensible decisions about their graph. This decision making is the key skill in drawing a good graph.
Lines of best fit are a challenging concept for students because there is rarely a totally correct solution, but there is often a wrong one. I will be looking at some key aspects of drawing and using lines of best fit. This is particularly relevant to your studies, with graphing and analysis forming an important part of the practical skills for A-level science assessment.
Your organisation does not have access to this article.
Sign up today to give your students the edge they need to achieve their best grades with subject expertise
Subscribe