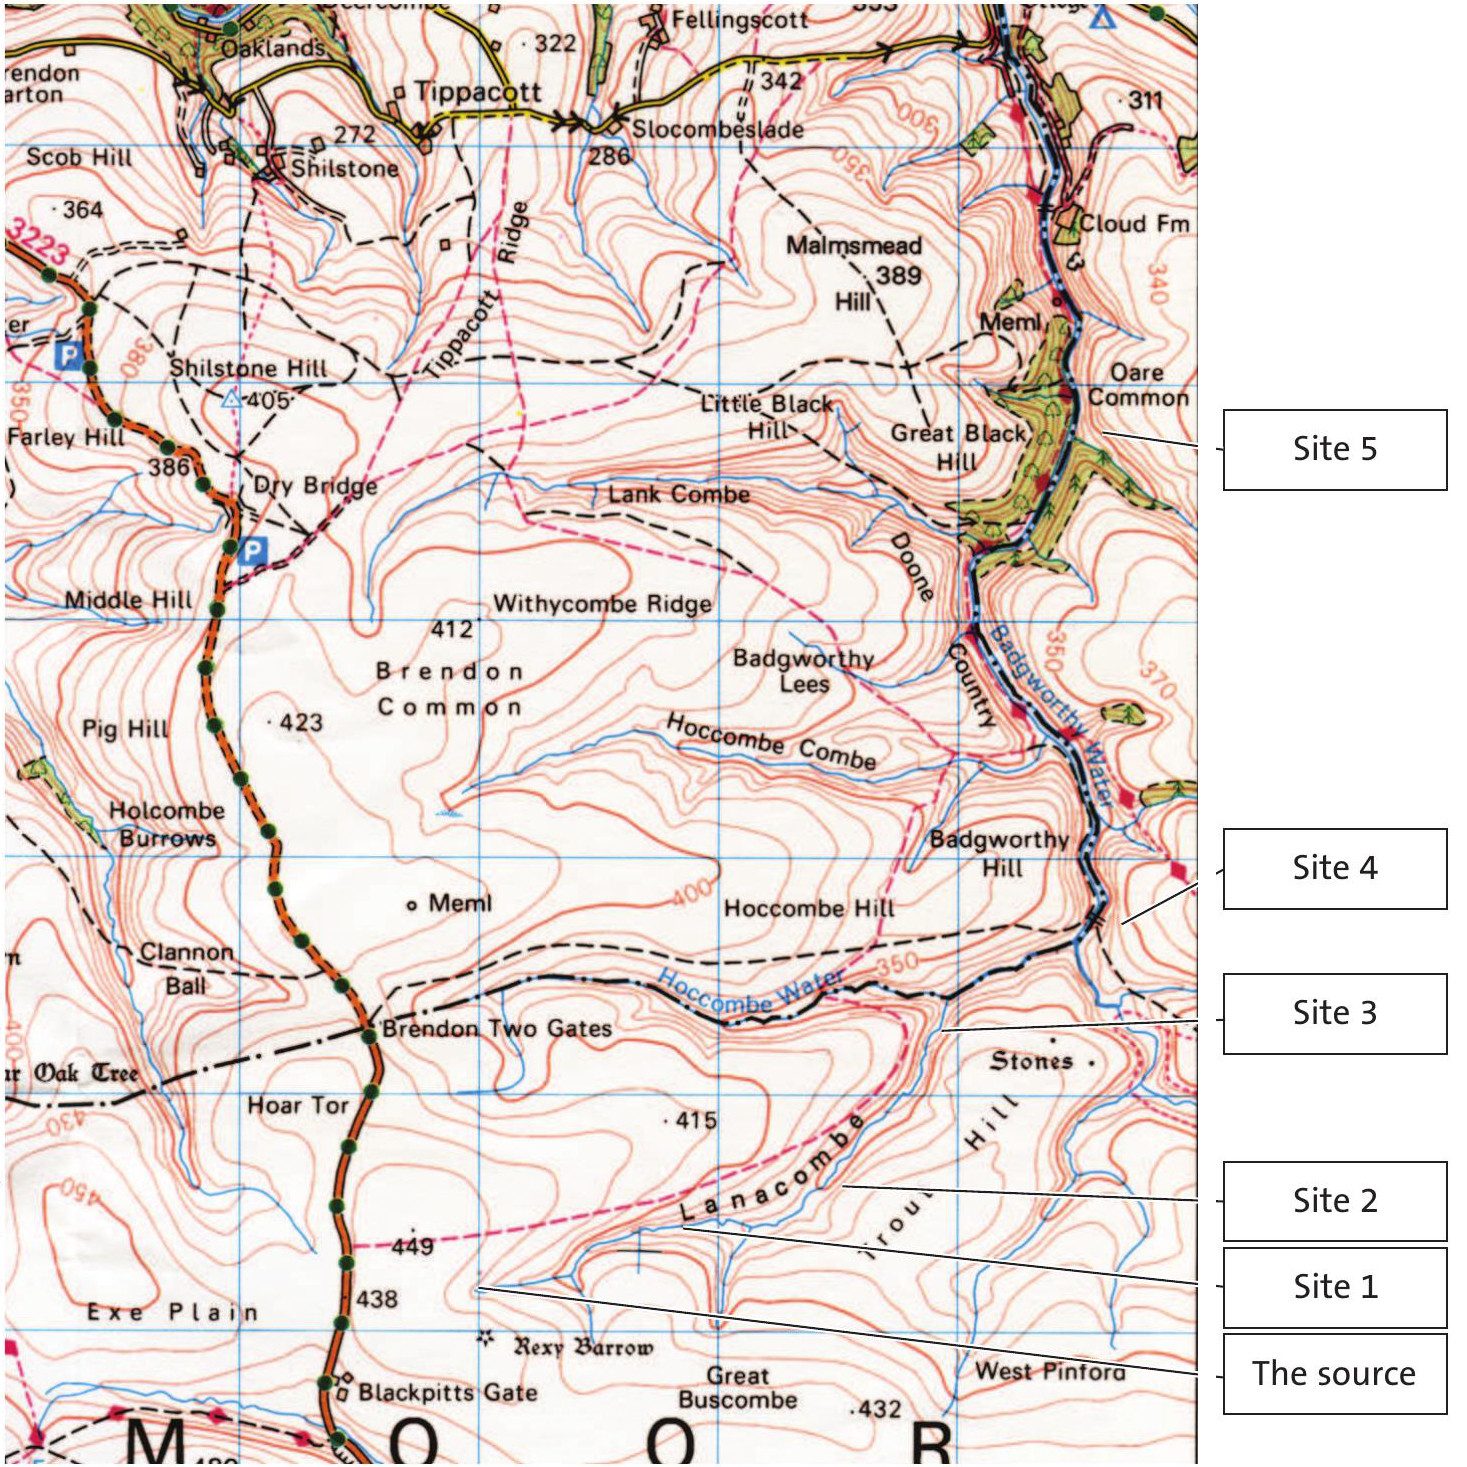
On 5 June 2008 we went to a source of the Badgworthy Water in the Doone Valley, north Devon. We took measurements at five different points along the river (shown in Figure 1) and collected a lot of different kinds of data, including the width and depth of the river at water level and bankfull (Figure 2), the ‘a’ axis of ten pebbles (Figure 3) and the slope angles for 10–50 metres on each river bank (Figures 4 and 5). In this way we had a wide range of data.
We were trying to prove that the further downstream we travelled, the wider and deeper the river became and the more rounded the pebbles. We also expected that the banks would become less steep and that we would find floodplains.
Your organisation does not have access to this article.
Sign up today to give your students the edge they need to achieve their best grades with subject expertise
Subscribe