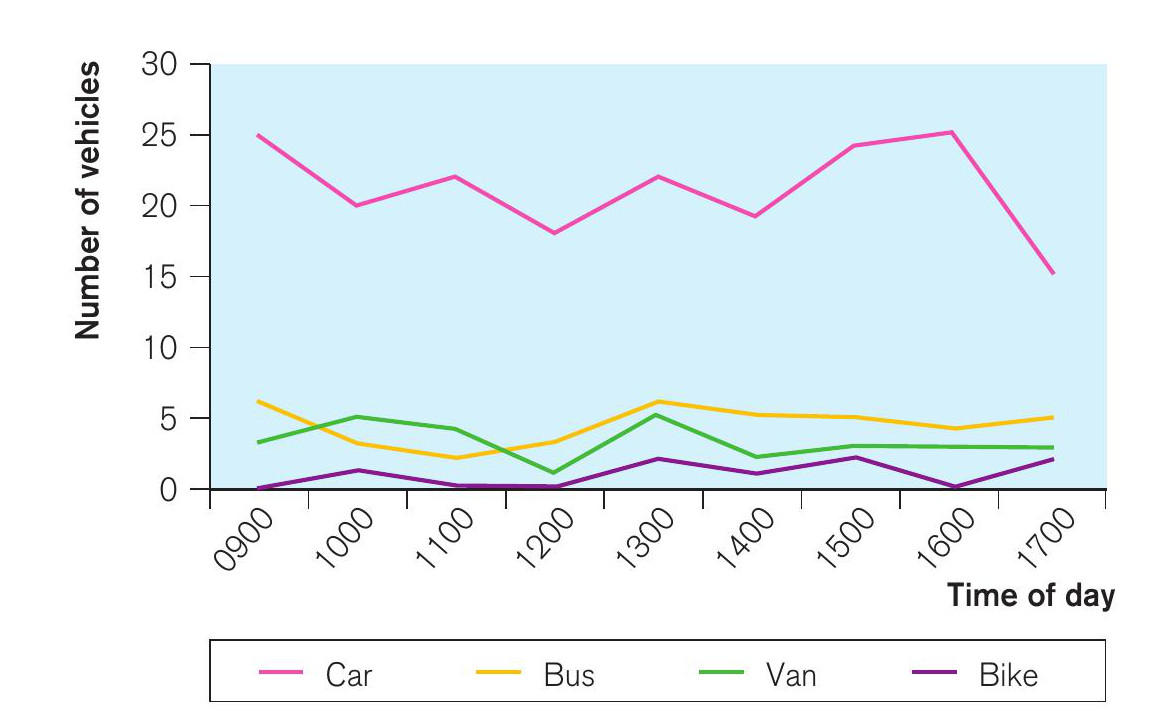
Figure 1 Line graph showing the number of vehicles entering Norwich CBD at St Stephen’s Street
Once you have collected your fieldwork data, you must decide how best to present them. You should try to include as many appropriate data representation techniques as possible. Some types of data lend themselves to simple representation, while others are more suited to more specialised techniques.
This Fieldwork Focus looks at the use of graphs, perhaps the most common form of data representation. To show a broad range of skills it is worth including a mixture of hand-drawn and computergenerated graphs. Remember to include a title and labelled axes on the graphs, and a key if needed.
Your organisation does not have access to this article.
Sign up today to give your students the edge they need to achieve their best grades with subject expertise
Subscribe