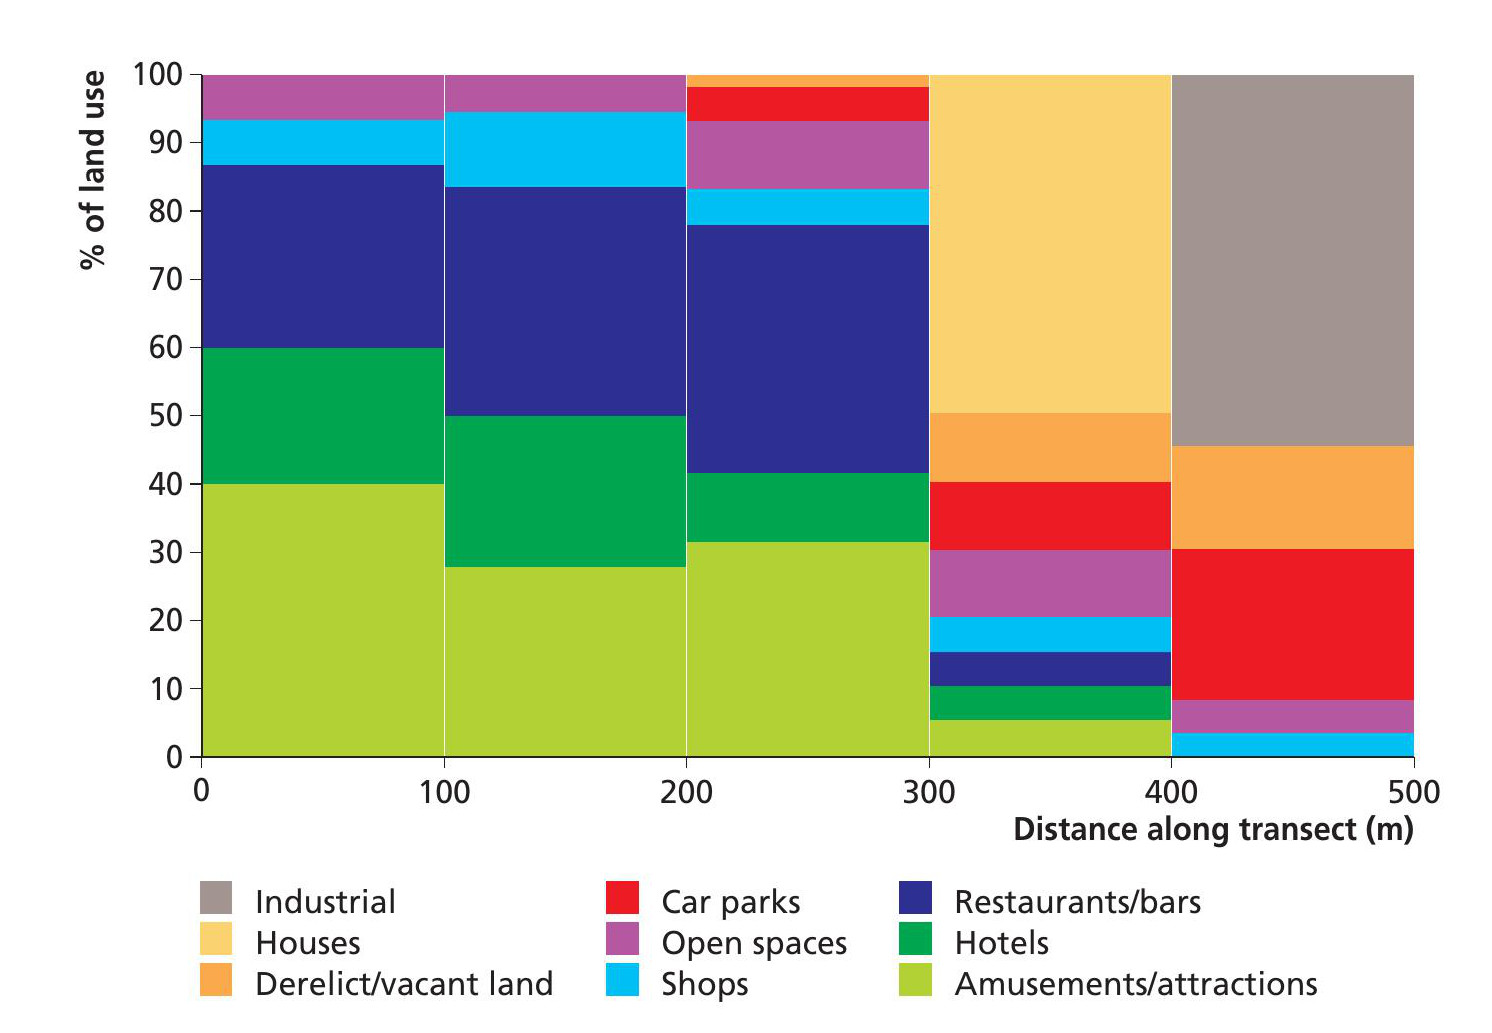
Figure 1 Block graph to show land-use changes along a transect in Great Yarmouth
Once you have collected your transect data it is important to think about presentation of the data, to demonstrate your understanding and skills as clearly as possible.
A block graph is suited to displaying data on changes in urban land-use. Kite diagrams are a sophisticated type of graph often used when examining vegetation changes, for instance along a sand dune transect or across a footpath.
Your organisation does not have access to this article.
Sign up today to give your students the edge they need to achieve their best grades with subject expertise
Subscribe