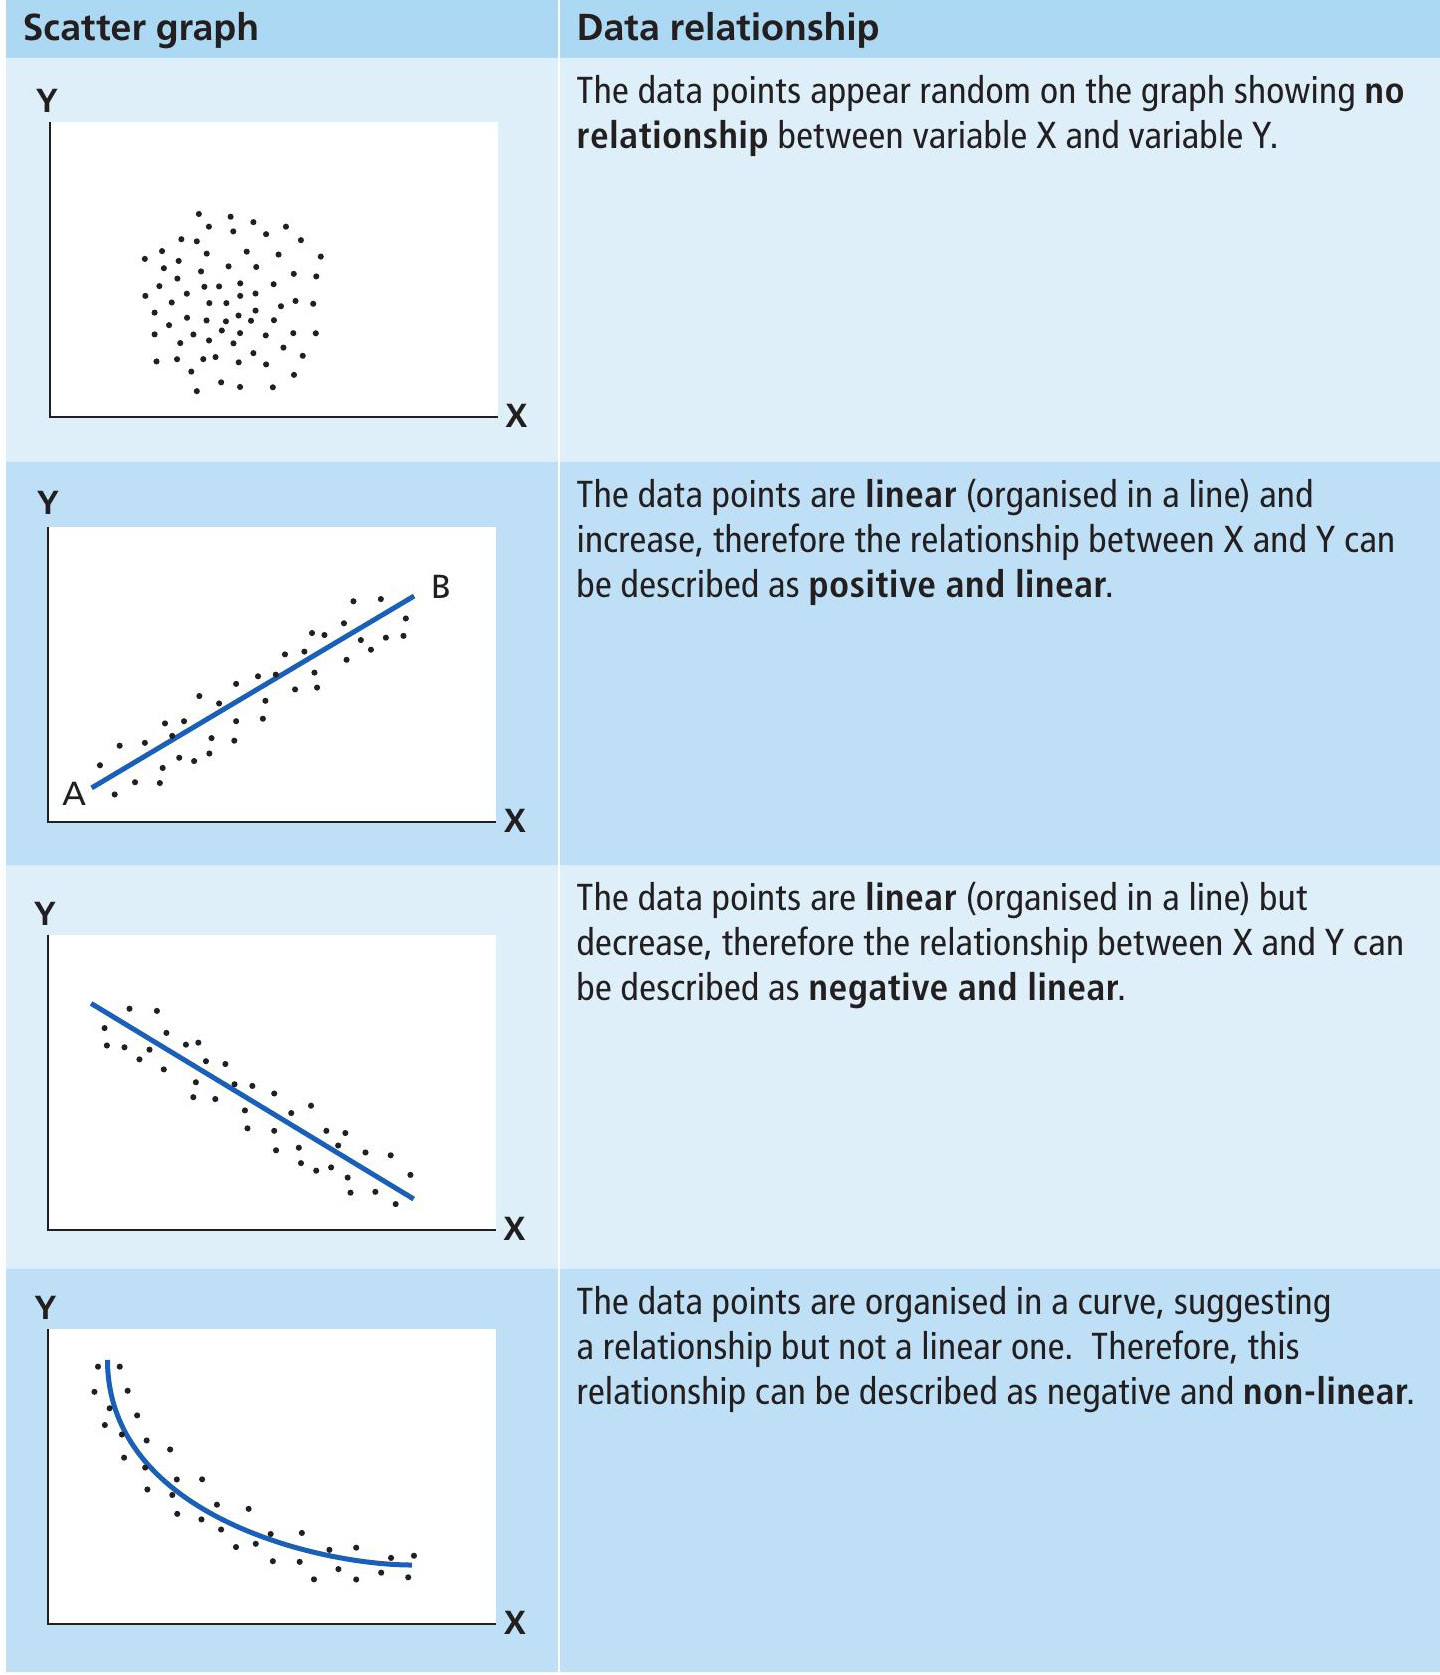
Table 1 Relationships between different sets of data
In geographical research we collect data to investigate how different variables may be related. For example, how the income of a country could affect its life expectancy, how the width of a river affects its velocity or how a pebble’s distance from a cliff affects its size.
If you plot these variables on a scatter graph you will be able to describe the relationship they have. Table 1 shows some examples of what your scatter graph might look like and how you would describe it using key terms.
Your organisation does not have access to this article.
Sign up today to give your students the edge they need to achieve their best grades with subject expertise
Subscribe