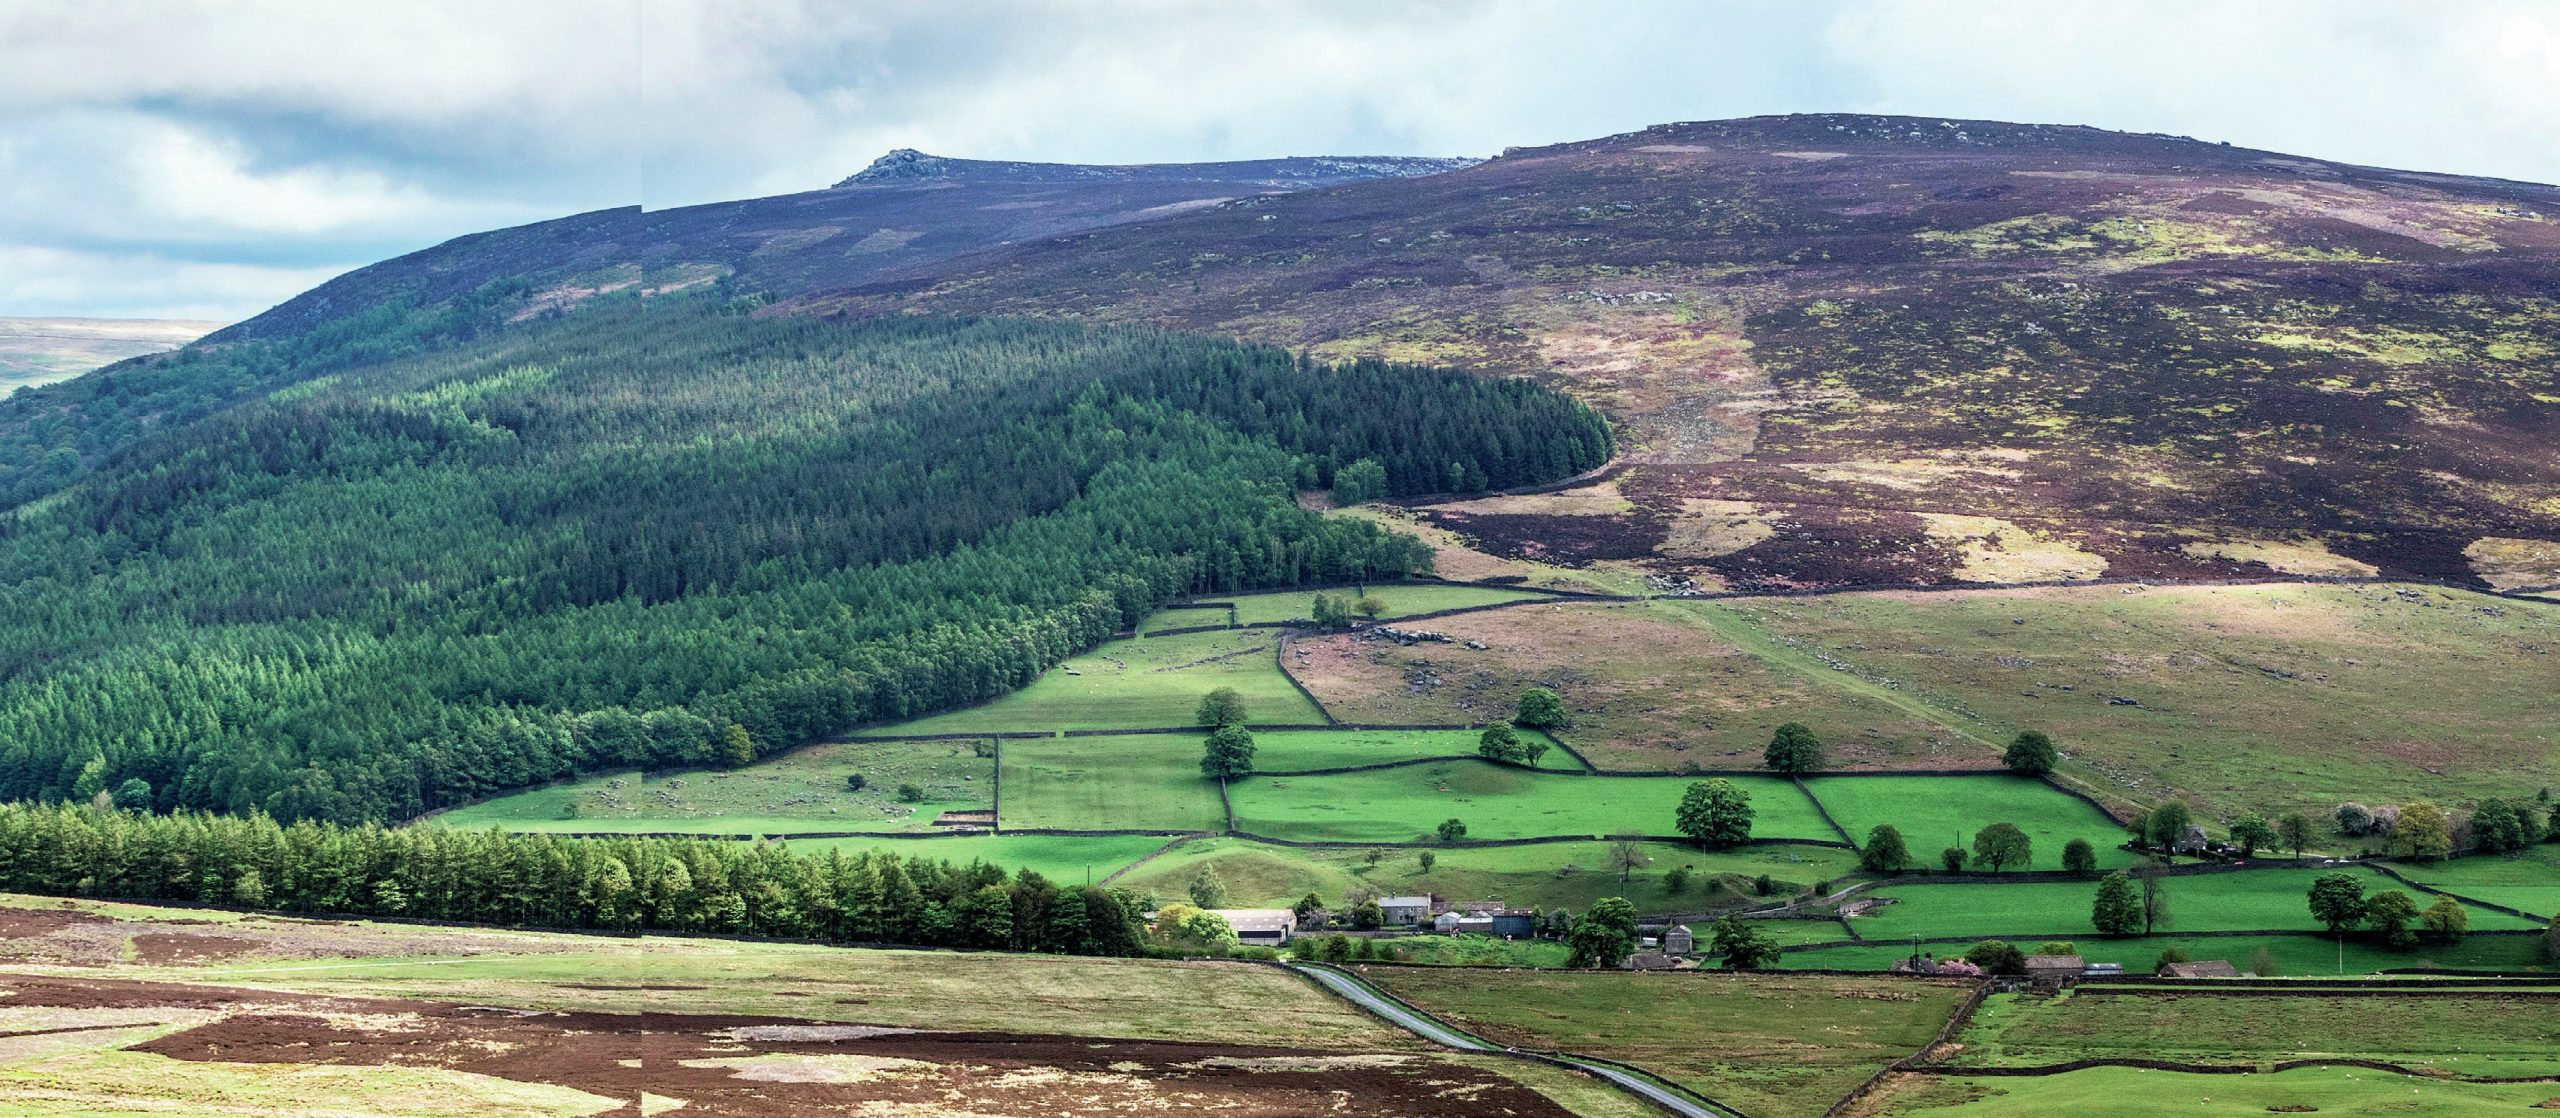
Barden Fell in the Yorkshire Dales
I soline maps are used to map the distribution of different types of data by drawing lines to link equal points. The most commonly recognised isoline graphs are those showing atmospheric pressure or temperature on a weather map, which you may have seen on television, or the lines showing the relief on a map — these are called contour lines.
Contour lines are used on Ordnance Survey maps — such as the one in Figure 1 — to show the relief of the land. These isolines are drawn by linking together points with the same height above sea level.
Your organisation does not have access to this article.
Sign up today to give your students the edge they need to achieve their best grades with subject expertise
Subscribe