Statistics help us to analyse geographical data and to draw conclusions. They can be used to compare data, to explore how reliable data are, to make predictions and to investigate relationships between sets of data. You can use statistics to investigate tables of data as well as graphs and charts, both of which will be covered in this two-part column. You might also have come across statistics in your maths lessons.
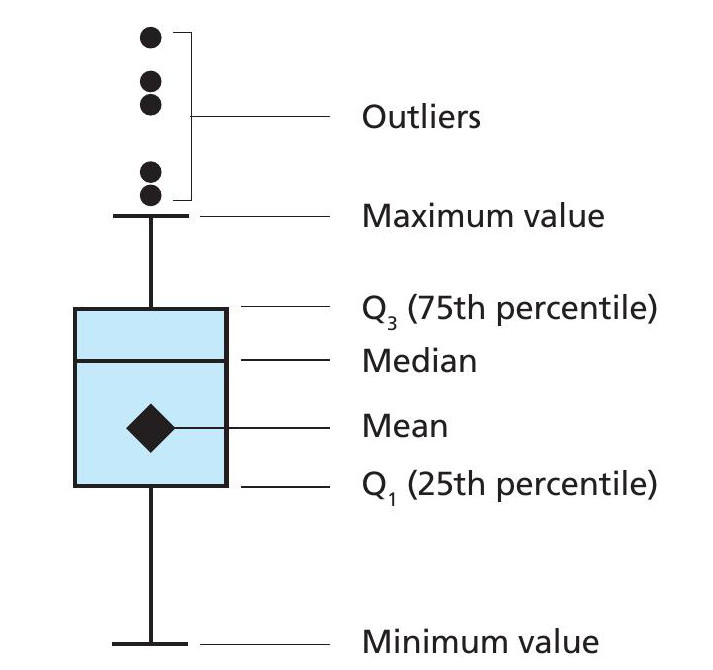
Mean, median and mode are ways of using statistics to summarise a set of data using a single number. They each represent a different aspect of those data, as shown in Table 1. Data can be either continuous, e.g. temperature, wind speed or the amount rainfall in a month, or discrete, e.g. the type of transport people use or the type of land use in an area.
Your organisation does not have access to this article.
Sign up today to give your students the edge they need to achieve their best grades with subject expertise
Subscribe